Fig. 5.

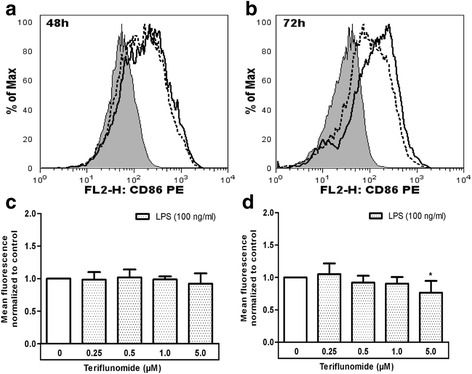
Teriflunomide leads to a decreased expression of CD86 in cultured microglia. Isolated microglia were treated with LPS (100 ng/ml) and different concentrations of teriflunomide (0.25–5 μM) for 48 or 72 h. a, b The histograms represent the CD86 expression levels on the microglial surface (filled: unstimulated cells; solid line: LPS-treated cells; dotted line: LPS-treated cells with 5 μM teriflunomide). c, d The mean fluorescence intensities obtained were normalized to LPS-stimulated control (black column). For comparison of the untreated (0 μM) and teriflunomide-treated samples (0.25–5 μM), a t test against the expected mean of one was used (n = 4–5). P values <0.05 were considered significant. Asterisks denote a significant difference versus the LPS-stimulated control (*p < 0.05)
