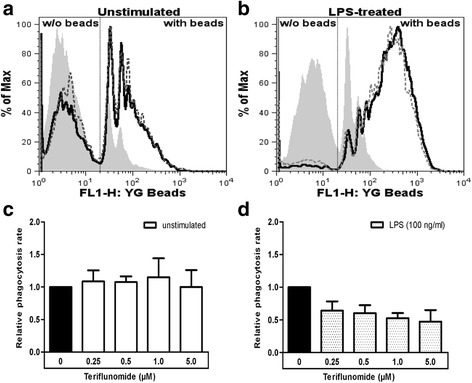
Fig. 7.

Phagocytic activity of microglia does not change after treatment with teriflunomide. Flow cytometric histograms of unstimulated (a) and LPS-treated (b) microglia represent the mean fluorescence intensity which displays the amount of incorporated fluorescent latex beads (filled: 4 °C control; solid line: cells without teriflunomide; dotted line: cells with 5 μM teriflunomide). c, d Data are expressed as the ratio of untreated microglia in relation to teriflunomide-treated microglia. All data are given as mean ± SD of four independent experiments. For comparison to medium control, repeated measures ANOVA with Bonferroni’s multiple comparison t tests was used
