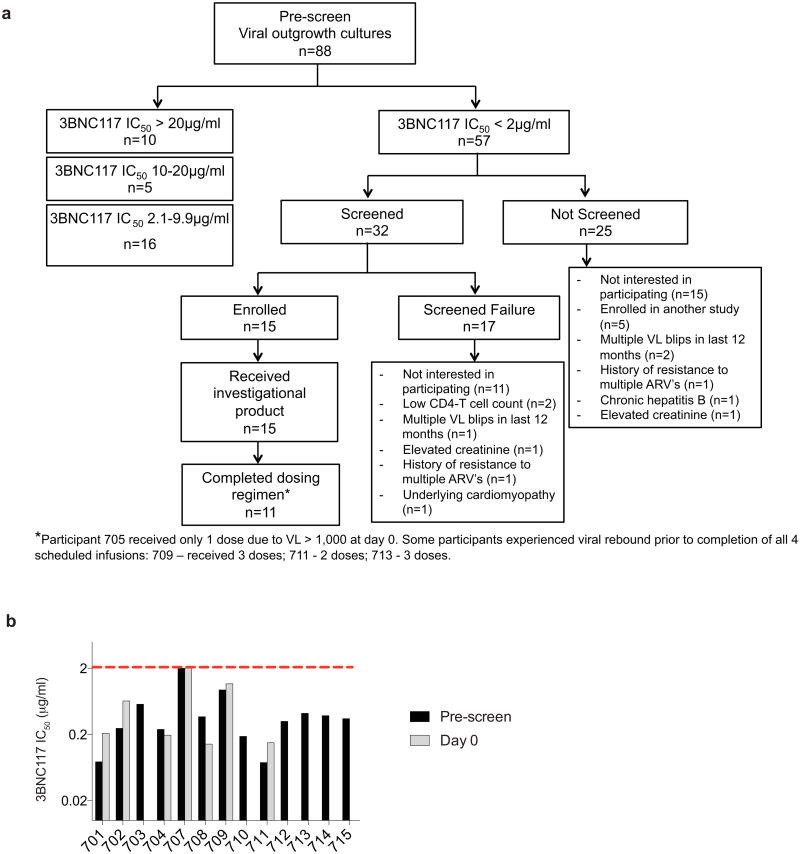
Extended Data Figure 1. Study participant selection and neutralization of pre-infusion cultures by 3BNC117.
a, Flow diagram showing the selection of study participants. b, Bar diagrams showing IC50 values (μg ml−1) in TZM-bl assays for 3BNC117 against bulk virus outgrowth culture supernatants from the indicated time point pre-infusion for each participant (Supplementary Table 3). For some participants both screen and day 0 cultures were obtained and showed less than threefold variation in IC50 values. The red dotted line indicates an IC50 of 2 μg ml−1 which was used as a threshold for inclusion in the study.

