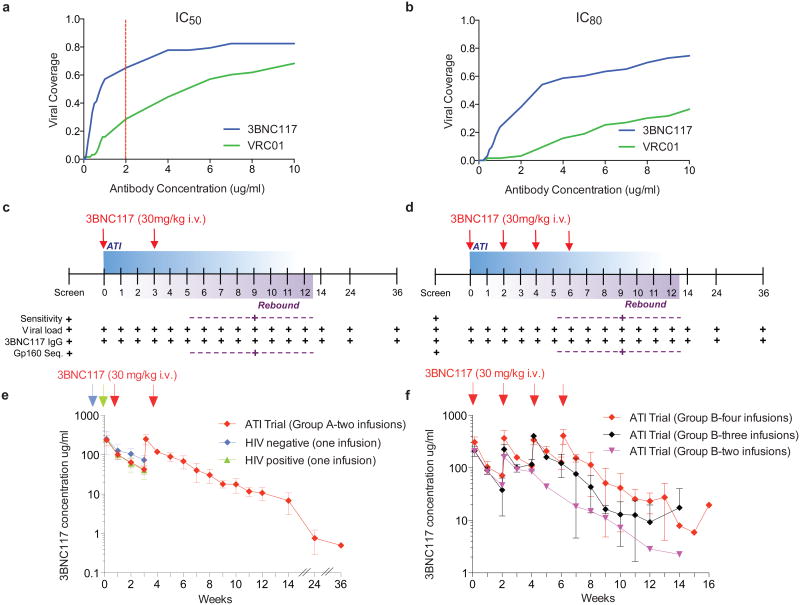
Figure 1. 3BNC117 neutralization coverage, trial design and pharmacokinetics of 3BNC117 in HIV-1-infected individuals during ATI.
a, b, Sensitivity of virus outgrowth cultures from 63 ART suppressed individuals to 3BNC117 and VRC01 (Supplementary Table 1). The y-axis shows the fraction of viral outgrowth culture supernatants neutralized by a given antibody concentration (x-axis) in Tzm-bl assays. Red line indicates cut-off IC50 (2 μg ml−1) for participation in the trial. c, d, Diagrammatic representation of study groups A and B respectively. 3BNC117 infusions indicated by the red arrows, and sampling for PK and virologic studies indicated below. Numbers indicate study weeks. e, f, 3BNC117 levels as determined by ELISA for group A (n = 6, left panel, red), group B (n = 7, right panel, red (n = 4), black (n = 2) and purple (n = 1)), HIV-1 negative (n = 3, blue) and viraemic individuals (n = 6, green)9. Curves indicate mean 3BNC117 levels, error bars the standard deviation. Arrows indicate 3BNC117 infusions.

