
Fig. 2.
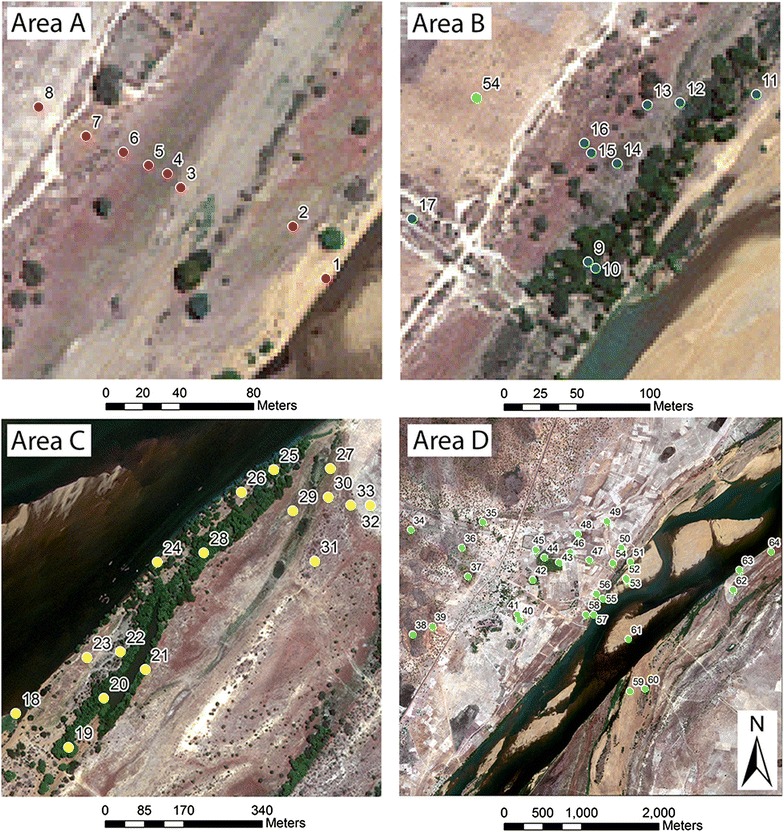
Detailed images showing sampling areas and exact locations where drop nets were placed. The numbers refer to the ID given to each sampling location and correspond with the ID values found in Table 1
Official websites use .gov
A
.gov website belongs to an official
government organization in the United States.
Secure .gov websites use HTTPS
A lock (
) or https:// means you've safely
connected to the .gov website. Share sensitive
information only on official, secure websites.
Detailed images showing sampling areas and exact locations where drop nets were placed. The numbers refer to the ID given to each sampling location and correspond with the ID values found in Table 1