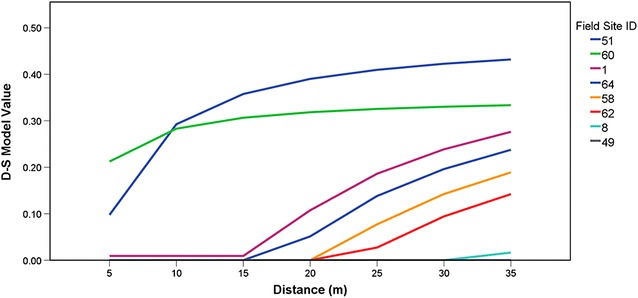
Fig. 3.

Changes in D-S model values with changing distance-from-vegetation breakpoint values (no count values). The distance at which the D-S value rose above zero for all the affected sites were averaged together for the final D-break point value. The field site ID correlates with the ID values found in Table 1
