Fig. 9.

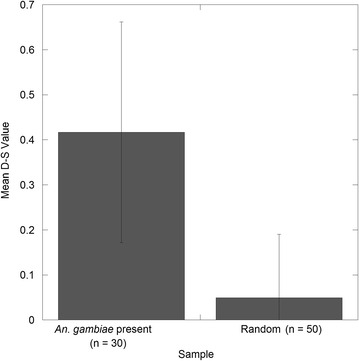
Mean of D-S values for locations where An. gambiae specimens were collected versus the D-S mean for 50 randomly sampled points. Error bars show the standard deviation

Mean of D-S values for locations where An. gambiae specimens were collected versus the D-S mean for 50 randomly sampled points. Error bars show the standard deviation