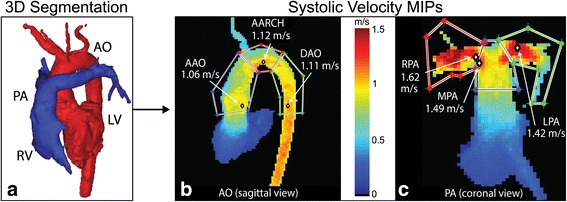
Fig. 1.

Methods workflow. a The aorta (red) and pulmonary (blue) volumes were segmented and separated from each other. The MIPs were viewed in 3 orientations (only one is shown here) and regions of interest were drawn to determine maximum velocities (white circles with black border) in the b aorta (AAO, AARCH, DAO) and c MPA, RPA and LPA
