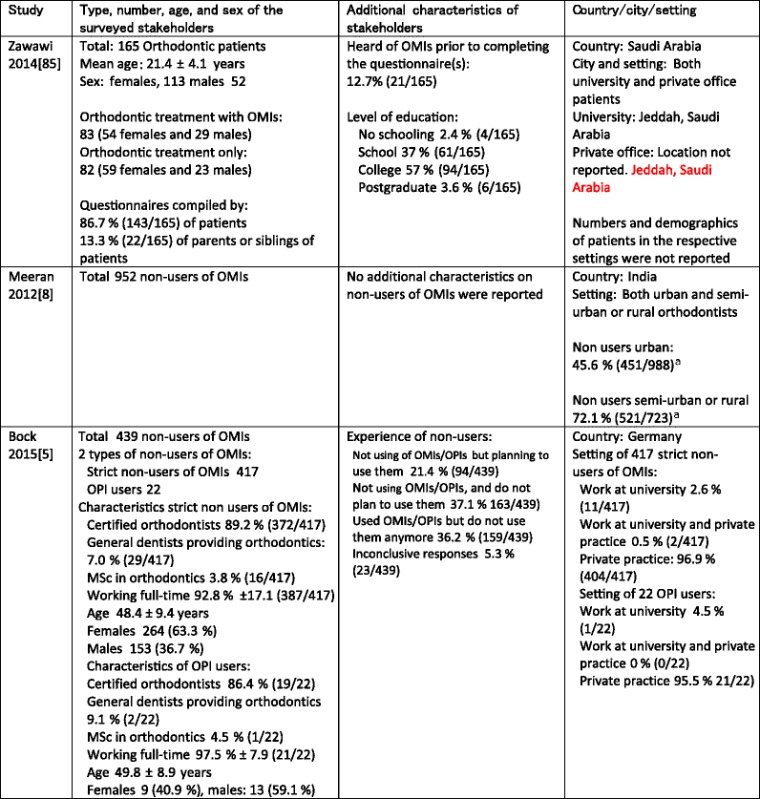
Table 4.
Type of stakeholders surveyed on implementation constructs and their settings a b

Items in black-type face represent those of the published manuscript. Items in red-type face represent those obtained through contacting the authors of the pertinent manuscript. For both the studies by Zawawi et al. (2014) [85] and Meeran et al. (2012) [8], these data are also representative for their responding populations because response rates were 100 %. For the study by Bock et al. (2015) [5], these data were not representative for the responding population because response rates were 78.6 % (345/439)
OPI osseointegrated palatal implant
aNumbers of non-users do not add up, i.e., 451 + 521 = 972 and not 952
