Fig. 1.
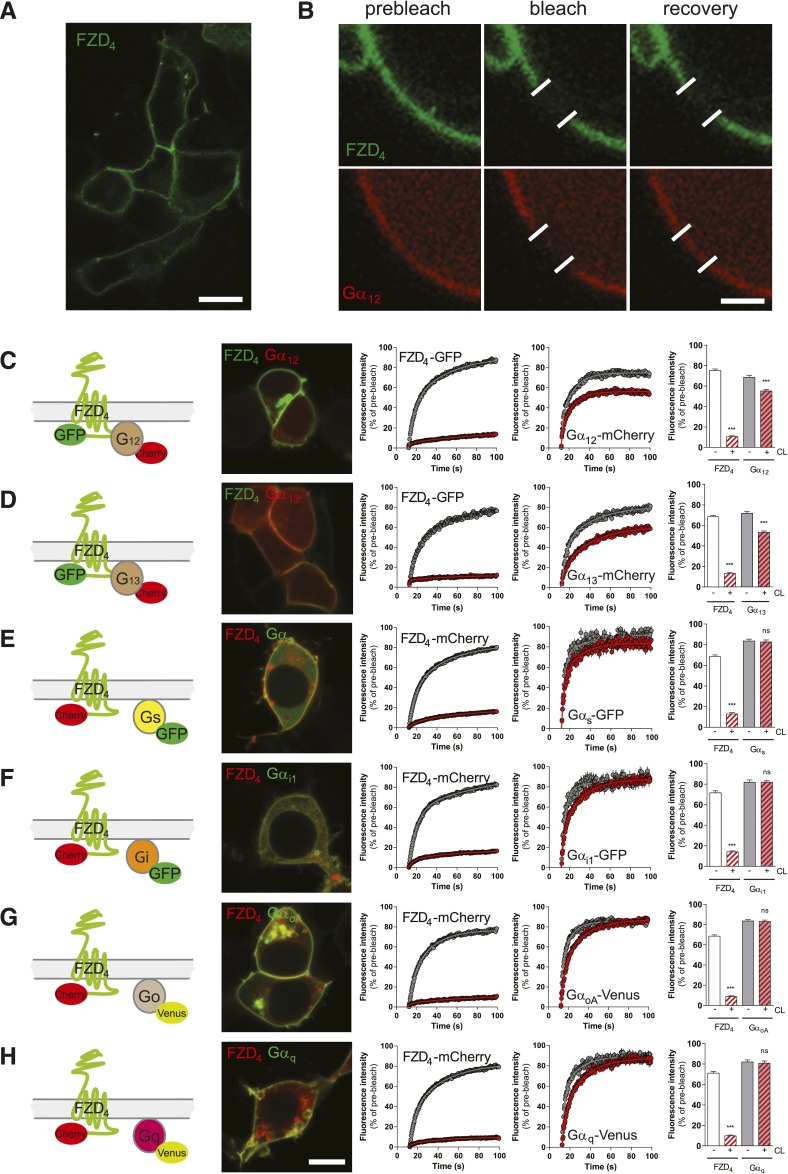
dcFRAP in combination with chemical cell surface crosslinking reveals FZD4-Gα12/13 complex formation. (A) HEK293T cells express fluorescently tagged FZD4 predominantly in the cell membrane. Size bar = 10 µm. (B) dcFRAP experiments are done in cells cotransfected with fluorescently tagged FZD4, Gα subunits, and untagged βγ subunits. Micrographs show FZD4-GFP and Gα12-mCherry before, shortly after, and about 100 seconds after the high-laser-power photobleaching in a region of interest (white lines). Surface proteins are chemically crosslinked (CL) by Sulfo-NHS-LC-LC-biotin and avidin. Size bar = 2 µm. (C–H) The figure includes a schematic presentation clarifying the experimental setup, a confocal micrograph showing HEK293T cells coexpressing FZD4 with the respective Gα subunit (size bar = 10 µm), fluorescence intensity curves before (gray) and after (red) CL for both FZD4 and the respective G protein and a bar graph summarizing the mobile fractions of FZD4 and the Gα subunit under each experimental condition. Color code for mobile fractions (consistent throughout the manuscript): white, FZD4 before CL; red hatched, FZD4 after CL; gray, Gα before CL; gray + red hatched, Gα after CL. ***P < 0.001 (n = 3). Error bars provide the S.E.M. ns = not significant.

