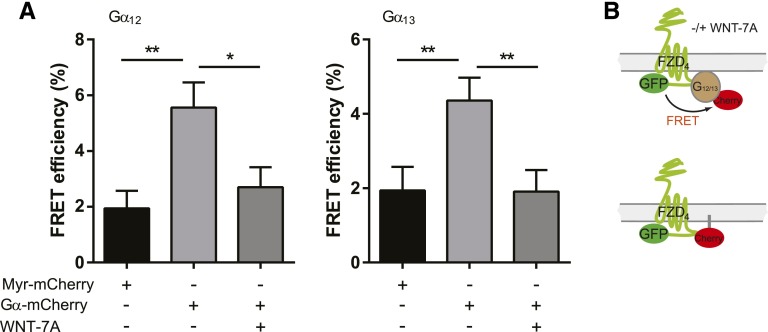
Fig. 4.
FRET analysis supports WNT-evoked FZD4-Gα12/13 complex dissociation. (A) FRET analysis performed in HEK293 cells expressing FZD4-GFP, untagged βγ subunits, and either Gα12- or Gα13-mCherry indicates that FRET between GFP and mCherry decreased in response to WNT-7A stimulation (300 ng/ml; 5 minutes). FRET measurements were performed with photoacceptor bleaching in fixed cells. Light grey bars show FRET between GFP and mCherry in the absence of WNT stimulation. Dark grey bars show FRET upon WNT stimulation. Black bars show FRET efficiency at baseline in cells expressing myristoylated mCherry as negative control. The bar graph summarizes data from three independent experiments with a minimum of 27 ROIs from different cells analyzed per individual experiment and condition. Bars and error bars provide the mean ± S.E.M., respectively. *P < 0.05; **P < 0.001. (B) The experimental setup is illustrated schematically.

