Fig. 5.
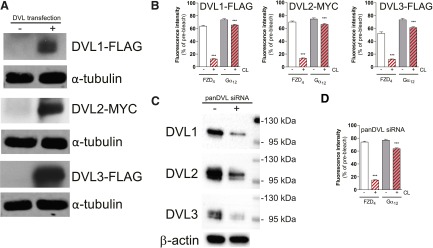
DVL does not play a central role for FZD4-Gα12/13 complex formation. (A and B) DVL1-FLAG, DVL2-MYC, and DVL3-FLAG were coexpressed in HEK293T cells. Cells that were used for dcFRAP were lysed afterward to assess DVL1, DVL2, and DVL3 levels in cellular lysates by immunoblotting using anti-FLAG or anti-MYC antibodies. α-Tubulin was used as the loading control. (B) dcFRAP experiments in cells coexpressing FZD4-GFP and Gα12-mCherry in the presence of DVL1, DVL2, or DVL3. Downregulation of DVL1, DVL2, and DVL3 by using pan-DVL siRNA did not affect FZD4-Gα12/13 assembly. Bar graphs summarize dcFRAP measurements from three independent experiments, each including data from several individual cells. Densitometry analysis of three independent experiments using panDVL siRNA and control indicated that DVL1, DVL2, and DVL3 were routinely reduced by 35–56% [values in percentage reduction in DVL1, DVL2, and DVL3 band intensity by panDVL siRNA compared with control siRNA (mean ± S.E.M.): DVL1 (40 ± 8%); DVL2 (56 ± 2%); DVL3 (35 ± 4%)]. For a graphical presentation of the DVL1, DVL2, and DVL3 levels in control and panDVL siRNA-treated cells (N = 3), see Supplemental Fig. 6. (C) Immunoblotting indicates reduced expression of the three endogenous DVL isoforms in HEK293T cells used for dcFRAP. (D) dcFRAP analysis in cells coexpressing FZD4-GFP and Gα12-mCherry shows no change in the mobile fraction of Gα12-mCherry upon CL in cells with reduced levels of DVL. ***P < 0.001 (n = 3). Error bars provide the S.E.M. Bar graphs summarize measurements from three independent experiments, each including data from several individual cells.

