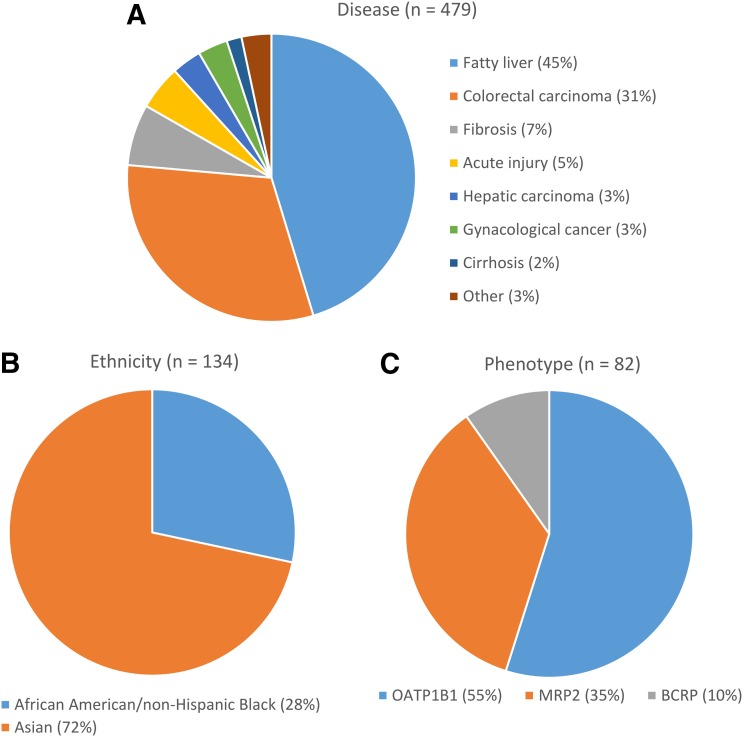
Fig. 2.
(A) Relative proportion of the different diseases associated with samples that were excluded from the complete database on the basis of disease. (B) Relative proportion of the different ethnicities associated with samples that were excluded from the complete database on the basis of non-Caucasian ethnicity. (C) Relative proportion of the transporters associated with samples excluded from the complete database on the basis of a non-ET phenotype. n represents the number of samples excluded.

