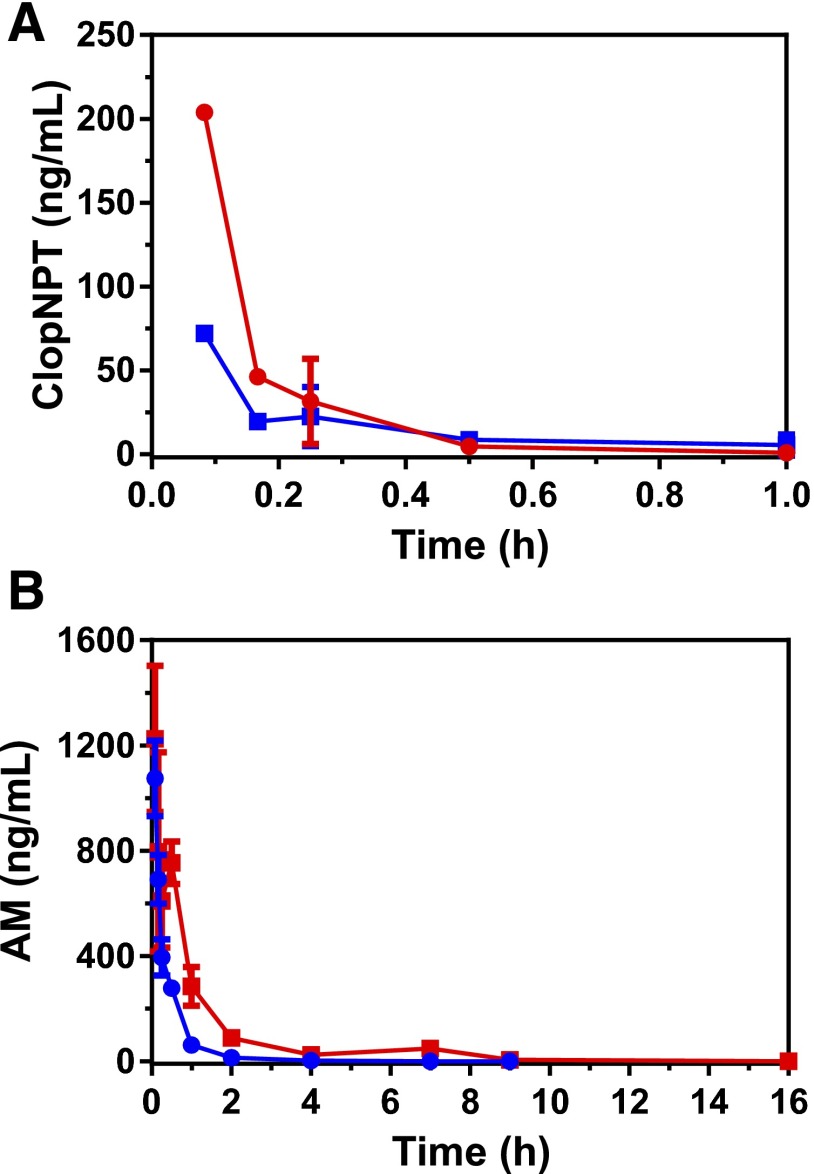
Fig. 1.
Determination of the pharmacokinetics of ClopNPT (A) and the active metabolite (B) in C57BL/6 mice. ClopNPT was administered to C57BL/6 mice (n = 3) as a 5-mg/kg intravenous bolus or a 10-mg/kg oral gavage. Blood samples were drawn at various time points and amounts of ClopNPT and the active metabolite were quantified using liquid chromatography–tandem mass spectrometry as described in the Materials and Methods. The PK parameters were obtained by fitting the data to a noncompartmental model using WinNonlin software. The red and blue traces indicate the pharmacokinetics after oral and intravenous administration, respectively. AM, active metabolite.

