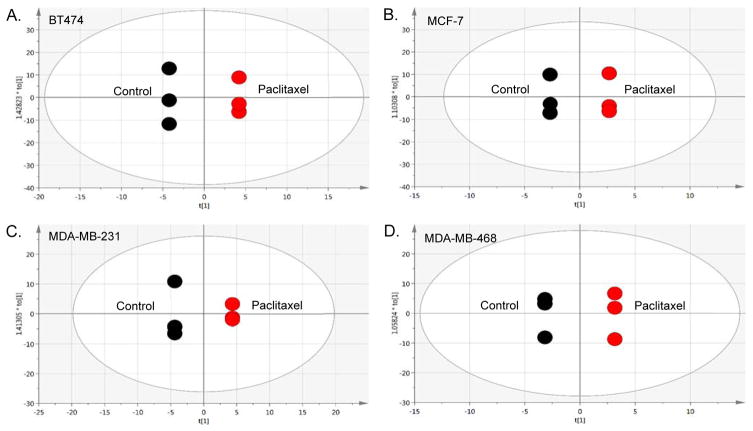
Figure 2. Multivariate analyses comparing breast cancer (BCa) cell lines in the presence of paclitaxel treatment.
The panels are pairwise supervised analyses (OPLS-DA) of non-treated controls compared to cells treated for 48 hr with paclitaxel [10 nM]. (A.) BT474 (ER+/PR+/HER2+) Luminal A cells. [R2X(cum) = 1, R2Y(cum) = 1, Q2(cum) = 1]. (B.) MCF-7 (ER+/PR+/HER2−) Luminal A cells. [R2X(cum) = 1, R2Y(cum) = 1, Q2(cum) = 1]. (C.) MDA-MB-231 is the TNBC cell line derived from a Caucasian woman. [R2X(cum) = 1, R2Y(cum) = 1, Q2(cum) = 1] (D.) MDA-MB-468 is the TNBC cell line derived from an African-American woman. [R2X(cum) = 1, R2Y(cum) = 1, Q2(cum) = 1].

