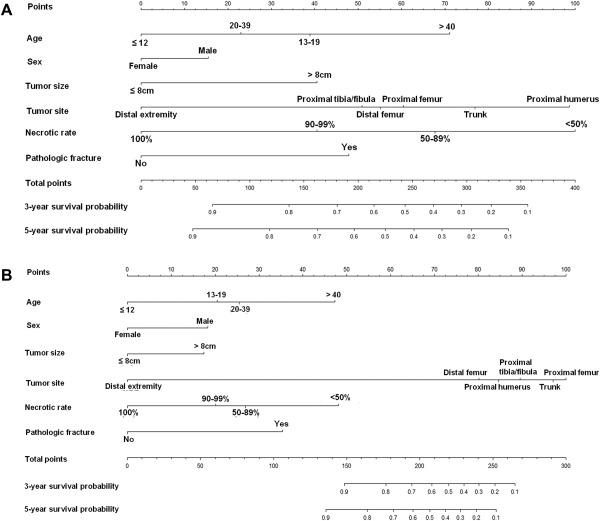
Figure 2.

Nomogram predicting the probability of (A) distant metastasis and (B) overall survival at 3 and 5 years. The patient's value for each variable is plotted on the appropriate scale, and vertical lines are drawn to the line of points to obtain the corresponding scores. All scores should be summed to obtain the total point score. The total point score on the total point line is plotted, and a vertical line is drawn down to the bottom line. The corresponding value shows the predicted probability of distant metastasis or death.
