
Figure 2.
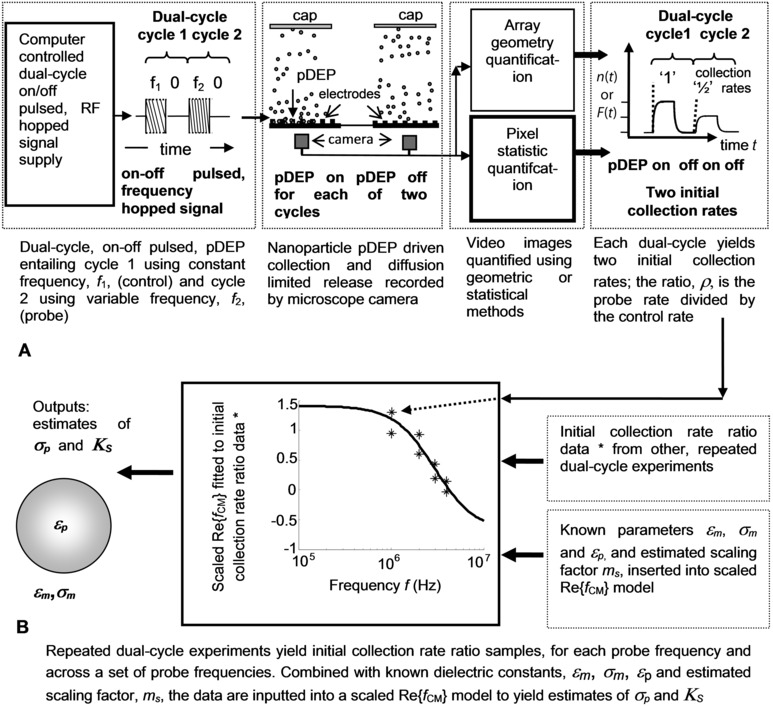
(A) Dual‐cycle, on–off pulsed, frequency hopped pDEP and fluorescence microscope image quantification using geometric or statistical methods—the latter which is the focus of this article. The dual‐cycle effectively generates a ratio of the probe nanoparticle number (or fluorescence) initial collection rate divided by the control, as shown. (B) Initial collection rate ratio data, spanning a range of frequencies, and in conjunction with other experimental parameters, enables fitting of the scaled Re{f CM} and evaluation of the nanoparticle conductivity and surface conductance.