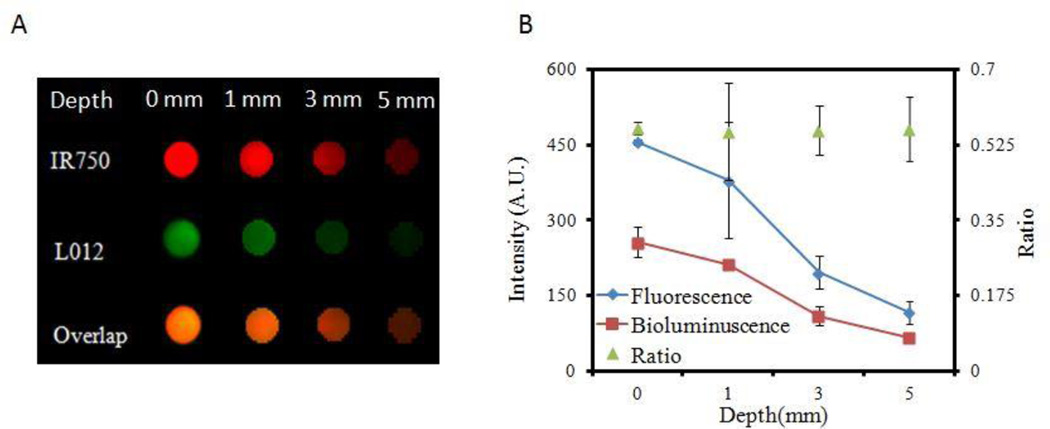
Figure 4.
The effect of tissue thickness on ROS ratiometric probe measurements. (A) Image of fluorescence (IR750), chemiluminescence signals (L012), and overlap signals shows the decreasing signal intensities with increasing phantom tissue thicknesses. (B) Chemiluminescence/fluorescence ratios remain nearly constant at all tissue thicknesses.

