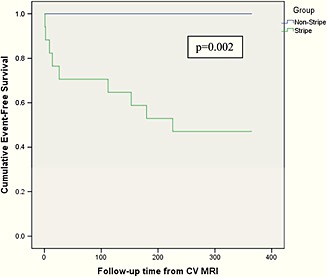
Figure 3.

Kaplan–Meier survival function. Kaplan–Meier curves compare patients with and without stripe from time (days) of CMR diagnosis to orthotopic heart transplantation/LVAD or death. During the follow‐up period, event rates for patients with and without +Stripe were 50% vs. 0, respectively (P = 0.002).
