
Figure 2.
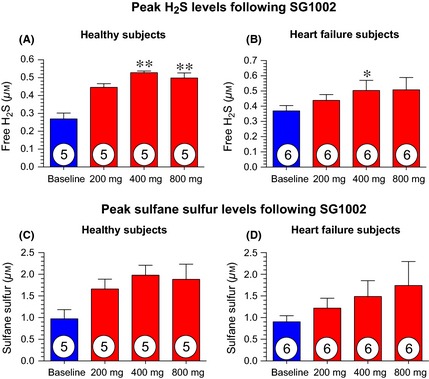
Peak sulfide levels for healthy and heart failure subjects following 1st dose of 200, 400 and 800 mg SG1002 (individual maximum concentrations reached 0.5–4 h post administration). (A) Peak free H2S levels following 200, 400 and 800 mg BID in healthy subjects. (B) Peak free H2S levels following 200, 400 and 800 mg BID in heart failure subjects. (C) Peak sulfane sulfur levels following 200, 400 and 800 mg BID in healthy subjects. (D) Peak sulfane sulfur levels following 200, 400 and 800 mg BID in heart failure subjects. *P < 0.05, **P < 0.01 compared to baseline (pretreatment values) using a 1‐way ANOVA with a Bonferroni multiple comparison correction test. Values are expressed as mean ± SEM.