
Figure 3.
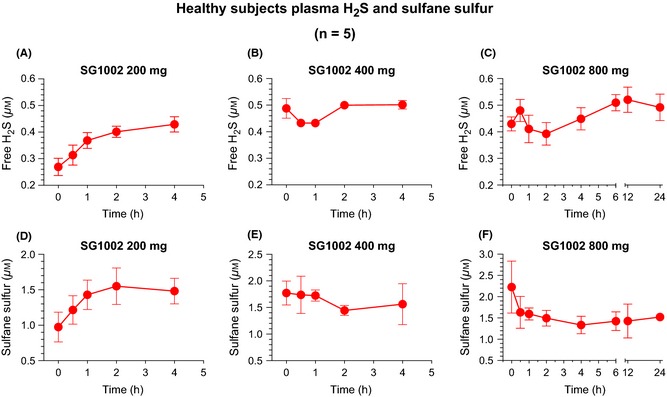
Pharmacokinetic analysis of free H2S and sulfane sulfur in healthy subjects. (A) Free H2S levels following 200 mg SG1002 BID, (B) 400 mg BID, and (C) 800 mg BID. (D) Free sulfane sulfur levels following 200 mg SG1002 BID, (E) 400 mg BID, and (F) 800 mg BID. Values are expressed as mean ± SEM. n = 5.