
Figure 2.
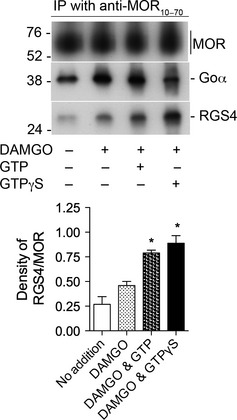
Activation of MOR with [D‐Ala2, N‐Me‐Phe4, Gly5‐ol] enkephalin (DAMGO) stimulates the association of RGS4 with MOR in a GTP‐dependent manner. Upper panel. Rat brain membranes were solubilized and processed as described in Methods (except in this experiment, intact membranes were not treated with DAMGO or guanine nucleotides prior to their solubilization). Soluble aliquots were incubated with 0.3 μM RGS4 alone, 0.3 μM RGS4, and 1 μM DAMGO, 0.3 μM RGS4, 1 μM DAMGO and 10 μM GTP or 0.3 μM RGS4, 1 μM DAMGO, and 1 μM GTPγS. Material immunoprecipitated by anti‐MOR10–70 was subjected to SDS–PAGE, and proteins were transferred to a nitrocellulose membrane. The top section of the blot was incubated with anti‐MOR349–398, the middle section with anti‐Goα, and the lower portion with anti‐RGS4. The densities of all bands were determined with ImageJ. Lower Panel. The experiment depicted in the upper panel was repeated two additional times. In each experiment, the density of each RGS4 band was divided by the density of the corresponding MOR band. The values of RGS4/MOR for each test group are displayed in the bar graph as mean ± SEM, n = 3. Of particular note, there was a 72% increase in the amount of RGS4 associated with MOR in the presence of DAMGO and GTP vs. DAMGO alone (unpaired, two‐tailed t‐test, * indicates p < 0.008). There was no difference in the densities of MOR among the four groups (two‐way anova, p = 0.60). There were differences in the levels of Goα among the groups: inclusion of DAMGO increased the amount of Goα (as was seen in Figure S2c) although the addition of GTP to DAMGO did not alter the amount of Goα associated with MOR (unpaired, two‐tailed t‐test, p = 0.79); and in six independent experiments, the addition of GTPγS decreased the association of Goα with MOR by 57 ± 7% (p = 0.02). These data are summarized in Table 1.