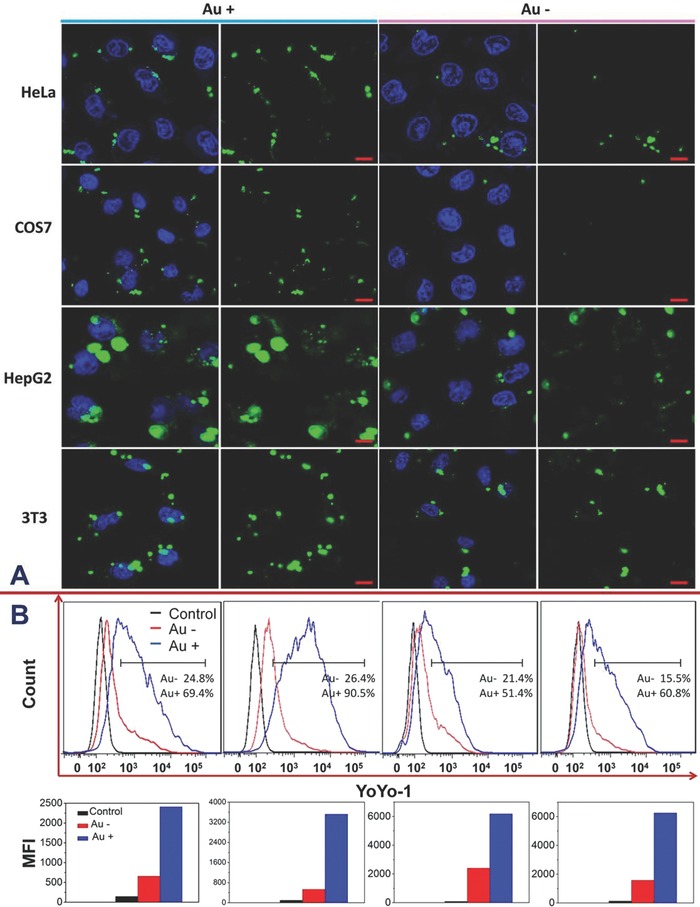
Figure 2.

A) Confocal images of various cell lines after the treatment with AuNP‐absent (Au−) or AuNP‐present (Au+) PEI1800/pGL‐3 nanocomplexes. The concentration of plasmid pGL‐3 was fixed at 1 μg mL−1. pGL‐3 were stained green by YOYO‐1 and nuclei were stained blue by Hoechst 33342. The scale bar was 20 μm. B) Flow cytometry profiles obtained after the treatment with PEI1800/pGL‐3 and PEI1800/DNA/AuNP (upper lane) as well as the comparison of the mean fluorescence intensity inside cells (lower lane). Blank cells were selected as the control. The mass ratio of AuNP versus DNA/vector nanocomplex was fixed at 7:1.
