
Figure 2.
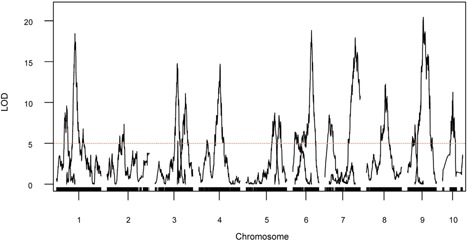
Genome‐wide logarithm of odds (LOD) plots for quantitative trait loci (QTLs) controlling vascular bundle number in BC2S3 recombinant inbred line (RIL) population Tick marks along the bottom axis represent genetic markers, curves represent LOD scores for QTL at each genomic position. The x‐axis shows the genetic position along the chromosomes in cM. The dotted horizontal line at LOD of 5 represents the threshold for significance as determined by 10,000 permutations of the data.