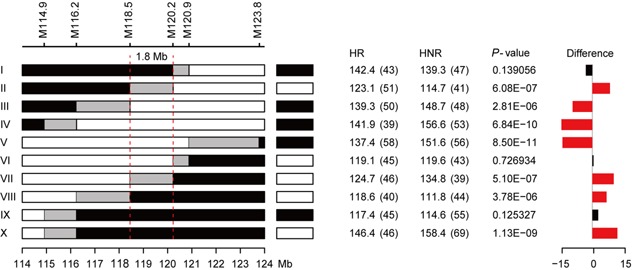
Figure 4.

Fine mapping of qVb9‐2 The recombinants identified in F2 population were grouped into ten groups based on their genotypes. Graphical genotypes of identified homozygous recombinants (HR) at the target region within each recombinant group are shown on left. Black or white boxes next to the HR indicate the corresponding homozygous non‐recombinants (HNR) identified within each recombinant family. Black, white and gray boxes indicate homozygous for maize allele, homozygous for teosinte allele, and regions where recombination occurred, respectively. The relevant markers are displayed at the top. The graphs on the right are the phenotypic difference comparison between HR and HNR pair for each recombinant group. The values in the columns of HR and HNR are the phenotypic mean for homozygous recombinants and homozygous nonrecombinants. The values in parentheses are the sample size for HR and HNR. The P‐value column is the exact P‐value for the comparison between HR and HNR pair. Red bars indicate significant difference at P < 0.01 after Bonferroni correction. Black bars indicate no significant difference observed between HR and HNR pair.
