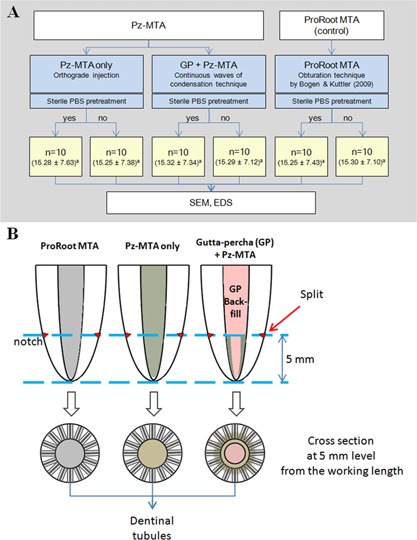
Figure 1.

A: Schematic diagram of the experimental groups. The number in parenthesis shows the mean and standard deviation of the canal curvature of each set of roots, and their same lowercase superscripts show no significant differences among the mean values of the canal curvatures (p > 0.05). B: Schematic diagram of the root specimen preparation for SEM evaluation. MTA, mineral trioxide aggregate; Pz‐MTA, pozzolan‐based mineral trioxide aggregate; GP, gutta‐percha; PBS, phosphate buffered saline; SEM, scanning electron microscopy; EDS, energy dispersive spectroscopy.
