
Figure 2.
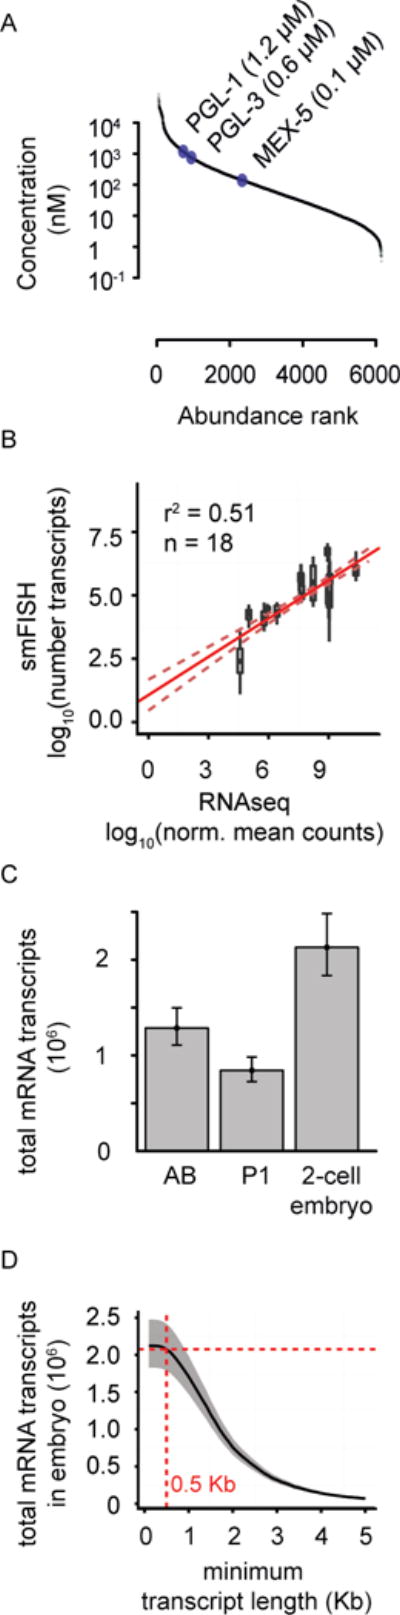
Measurements of intracellular protein and mRNA concentration in C. elegans embryo.
(A) Plot of the concentration and abundance of different proteins measured by mass spectrometry in C. elegans early-embryo extracts.
(B) Correlation plot of RNA-seq intensity values and corresponding smFISH single molecule counts using a dataset of 9 genes in both blastomeres (AB and P1 cells; 18 samples total) (Osborne Nishimura, PLoS Genetics 2015). Red line: Fit using linear regression analysis. Dotted red lines: 95% confidence interval.
(C) Estimates of total mRNA transcripts per blastomere (AB and P1 cells) and for the entire 2-cell embryo are shown. Error bars represent 95% confidence intervals.
(D) Cumulative frequency distribution for minimum lengths of mRNA transcripts in the 2-cell stage embryo (AB and P1 total). Grey shaded areas represent 95% confidence intervals. Red broken lines highlight the total number of mRNA transcripts predicted if only mRNA transcripts longer than 500 bases are included in the estimate.
See also Figure S2, Tables S1–S2.