
Figure 6.
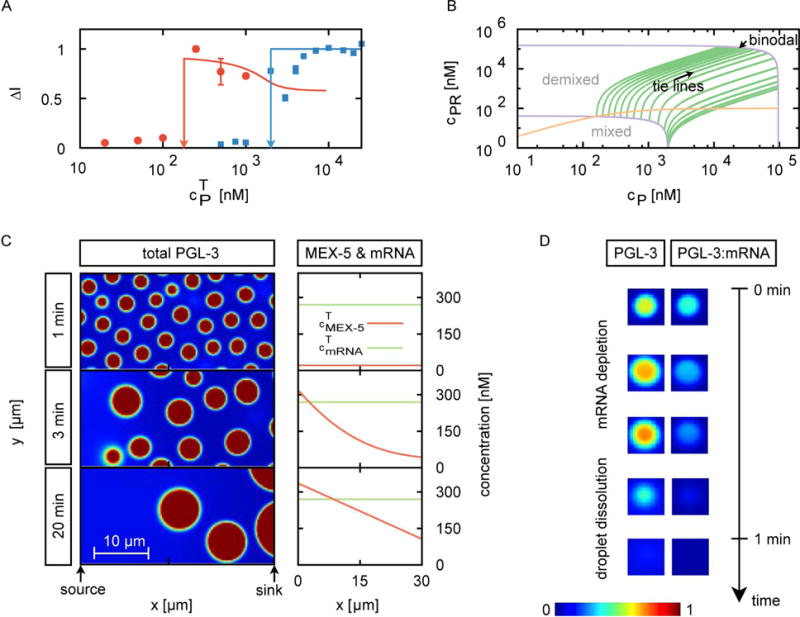
Theoretical model of PGL-3 phase separation, mRNA binding and interactions with MEX-5.
(A) Experimentally determined difference ΔI between concentrations of PGL-3 inside and outside of drops for different overall PGL-3 concentration (cPT) in the presence (red dots) or in the absence (blue squares) of 50 ng/μL mouse brain mRNA. This is a different representation of the data presented in Figure 3D. For details on measurement of ΔI, please see methods section. Solid lines are the corresponding fits obtained from our theoretical model. Vertical arrows indicate the threshold concentrations above which phase separated droplets form in presence of mRNA (cPR*) or in absence of mRNA (cP*). Error bars represent 1 SEM.
(B) Phase diagram calculated from our model for the ternary mixture consisting of PGL-3, PGL-3 bound to mRNA (PGL-3:mRNA) and water. As the total concentration of PGL-3 (cPT) is increased keeping the total concentration of mRNA constant (along the orange line in the phase diagram), mRNA binds to PGL-3 and the system equilibrates to certain concentrations of PGL-3 (cP) and PGL-3:mRNA (cPR). The binodal lines (purple) split the regions where the solution is mixed (no drops form) or demixed (drops form via phase separation). In absence of drops in the mixed region of the phase diagram, the system equilibrates to a unique concentration of PGL-3 (cP) and PGL-3:mRNA (cPR). In the drop-containing demixed region of the phase diagram, for a given total concentration of PGL-3 and mRNA, there are two distinct sets of values of cP and cPR corresponding to concentrations inside and outside of drops. The green lines connecting these two sets of concentration values are called ‘tie lines’. Using the tie lines, we can construct the behavior of ΔI as a function of cPT as shown in A (for more details see methods section and movie S3).
(C–D) Results from numerical calculations for the six-component system consisting of mRNA, PGL-3, PGL-3:mRNA, MEX-5, MEX-5:mRNA and water.
(C) Snapshots of the total PGL-3 concentration as a function of time and space (left) and plots at each time point of the concentration of total MEX-5 and total mRNA (averaged over the y-coordinate) as a function of position along x-axis (right).
(D) Representative time series show dissolution of a drop in a region of high MEX-5 concentration. mRNA is depleted from drops before the drop dissolves.
See also Figure S6, Movies S3–S5, Table S3.