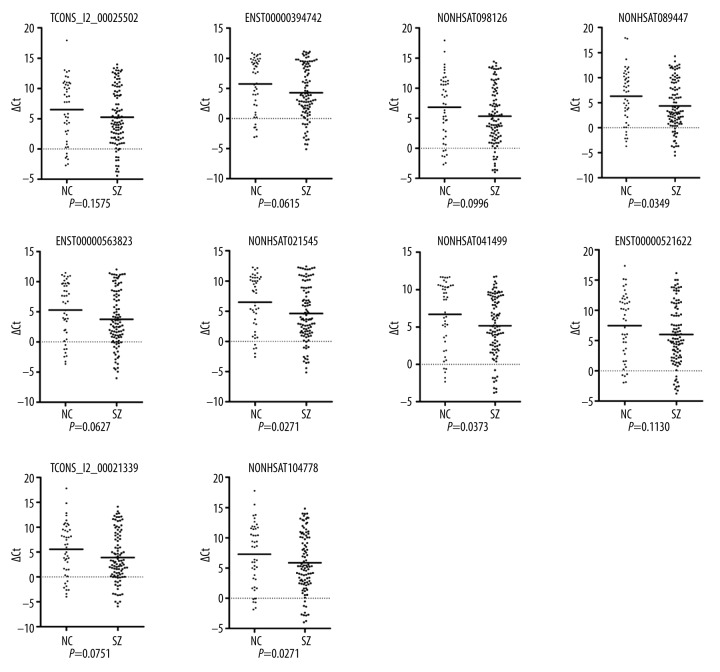
Figure 2.
Validation of the expression of lncRNAs by qRT-PCR analysis in the peripheral blood mononuclear cells from schizophrenia patients (n=106) and normal controls (n=48). The line represents the median value, and the plots were constructed by using GraphPad Prism 5 software. Statistical difference was analyzed using the Mann-Whitney U test.

