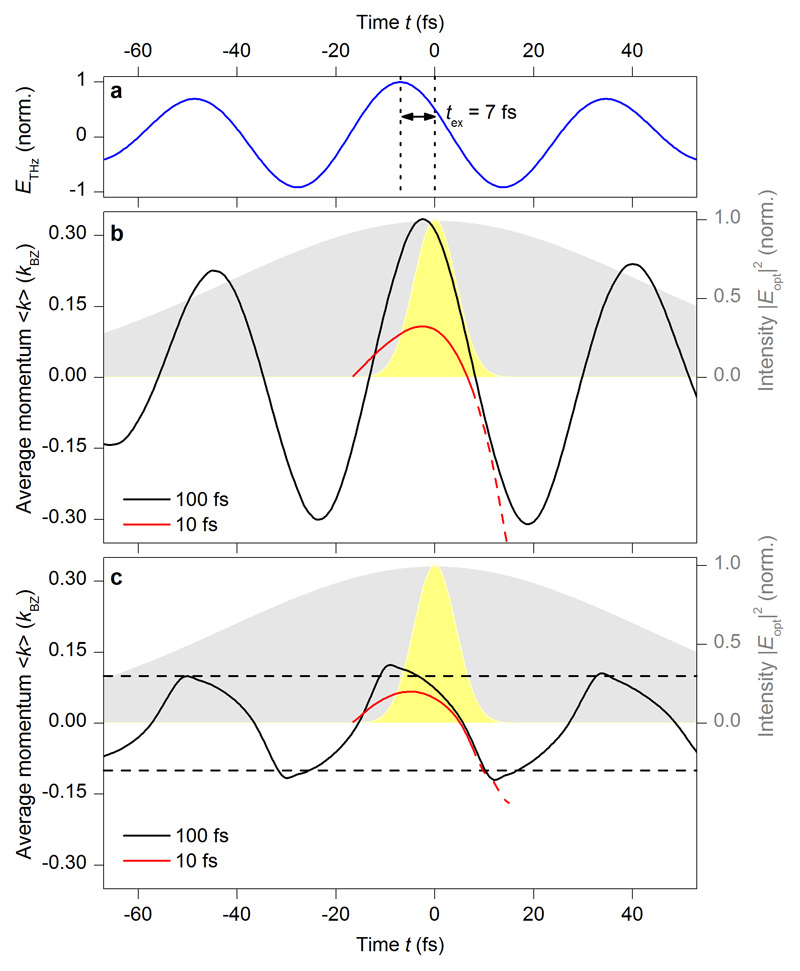
Extended data Figure 6. Influence of excitation-induced dephasing.
a, Terahertz waveform used in the computations. b, c, Mean electron excursion 〈k〉 calculated with a constant dephasing T2 = 12 fs (b) and EID (c) for a delay of tex = 7 fs (see vertical dotted lines in a). The shaded areas indicate the intensity envelopes of the excitation pulse with a full width at half maxima of 10 fs (yellow) and 100 fs (gray), respectively. The corresponding mean momenta 〈k〉 are shown as red and black curves, respectively. The red-dashed curves show 〈k〉 after the electron-hole collision. The dashed horizontal lines mark the positions in k-space, where the scattering time T2(k) switches from slow to fast dephasing.

