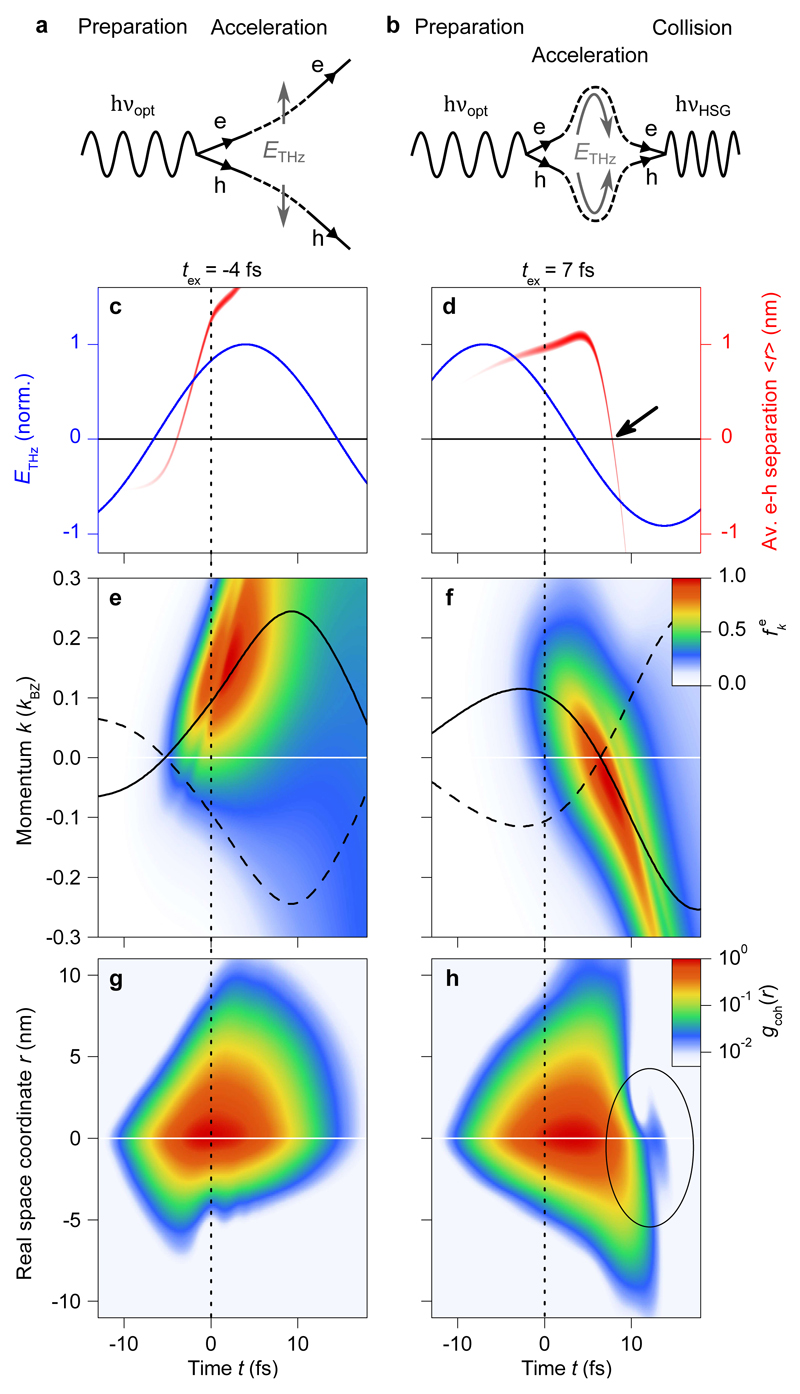
Figure 3. Quantum simulation of sub-cycle electron-hole collisions underlying HSG.
a, b, Schematic Feynman diagrams depicting electron-hole (e-h) pair creation by a near-infrared photon (hvopt) and acceleration by ETHz: Only for ‘good’ excitation times (b), the acceleration leads to a collision and annihilation of the electron-hole pair, thereby emitting a sideband photon hvHSG. c, d, Trajectories (red, the intensity of the line represents the density of coherent excitons) tracing the real-time evolution (time t) of mean electron-hole separation (weighted average of gcoh(r)) for characteristic delays tex corresponding to minimum (c) and maximum HSG emission (d, compare Fig. 2c). Vertical black dotted lines highlight t = 0, which marks the peak of the excitation pulse. While electrons and holes are initially separated, they rapidly recollide (zero excursion marked by the black horizontal lines; time of recollision is highlighted by the black arrow in panel d) upon reversal of the driving field (blue curves), inducing a strong HSG signal (d). For ‘bad’ excitation times, the electron-hole separation increases monotonically, prohibiting recollisions (c). e, f, Occupation of the first conduction band as a function of time t and crystal momentum k for delays of tex = -4 fs and 7 fs, respectively (colour-coded, see key). Horizontal white lines mark k = 0. Black solid (dashed) curves trace the weighted average excursion of electrons (holes) in reciprocal space. g, h, Coherent electron-hole correlation function gcoh(r) in dependence on time t and real space coordinate r. Interference patterns occur after the abrupt collapse of coherence caused by e-h recollision (highlighted by the black ellipse in h) which are absent for tex = -4 fs (g). Horizontal white lines mark r = 0.

