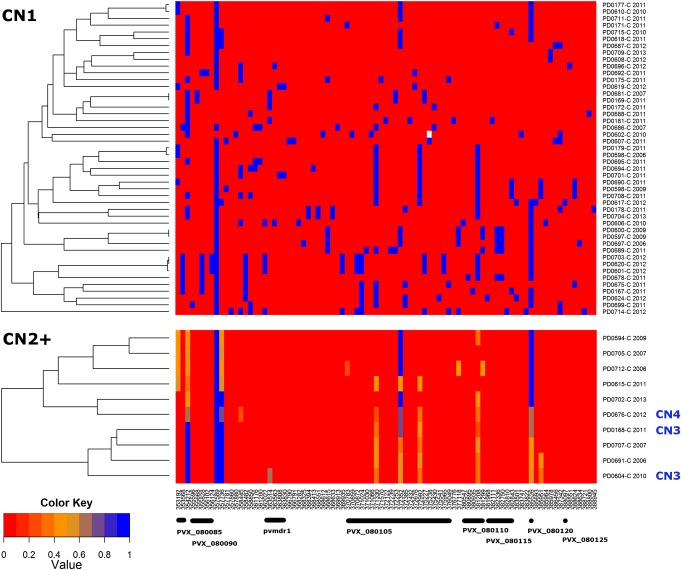
Figure 2.
Heat map illustrating the relatedness of multilocus genotypes (MLGs) in the pvmdr1 region in CN1 (top) and CN2+ (bottom) isolates. MLGs were reconstructed using allele frequency data at 87 single-nucleotide polymorphisms in the amplified region. Color is used to represent the nonreference allele frequency (proportion of reads containing the nonreference allele within that sample). Homozygote reference (Sal1) alleles are presented in red (0.0) and alternative alleles in blue (1.0). Missing genotype calls are colored white. Copy number (CN) definitions are based on genomic read depth results. Samples with a FWS of < 0.95 have been excluded. MLGs are labeled with a sample identifier and year of collection.

