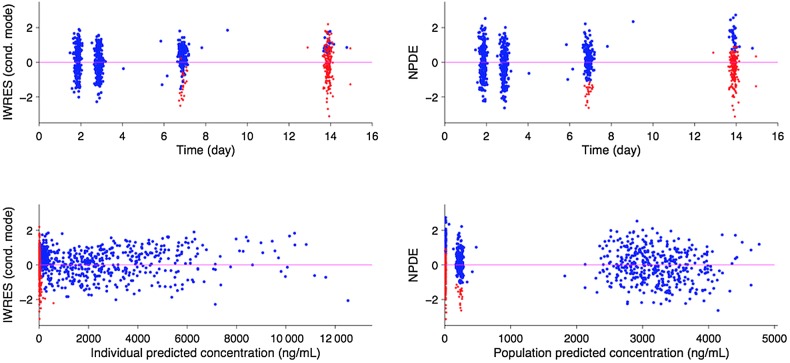
Figure 3.
Goodness of fit plots for the final model, illustrating individual weighted residuals IWRES, based on the conditional (cond.) mode versus time (top left) or individual predictions (bottom left) and the normalized prediction distribution error (NPDE) plots versus time (top right) or population prediction (bottom right). Data are represented by points (red for predicted concentrations whose actual values are below the LOD and blue for all other concentrations). Graphs patterns (absence of systematic relationships between x and y variables) suggest reasonable specification of the structural and error models.

