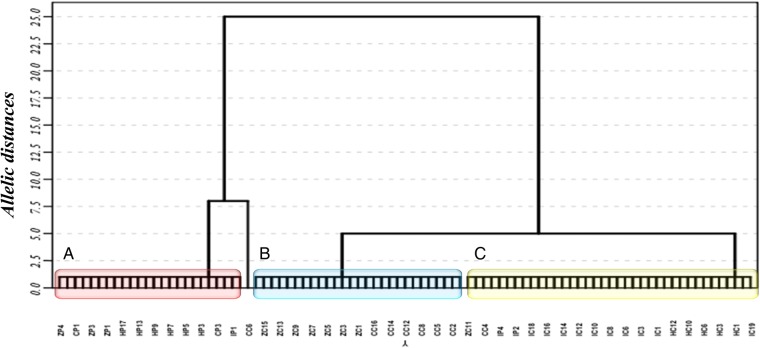
Figure 1.
Microsatellite genetic distances tree obtained from the samples analyzed of the outbreaks studied. The red cluster (A) shows samples from opossums, canines, and humans associated with the outbreak in Paz de Ariporo. The blue cluster (B) shows samples from opossums and canines involved in the outbreak in Restrepo. The yellow cluster (C) shows samples from triatomines and humans associated with the Restrepo outbreak. The identifiers in the x-axis are as defined as follows: among the first letters, “Z” denotes opossums, “C” denotes canines, “I” denotes triatomines, and “H” denotes humans; and among the second letters, “P” denotes the Paz de Ariporo outbreak, and “C” denotes the Restrepo outbreak.

