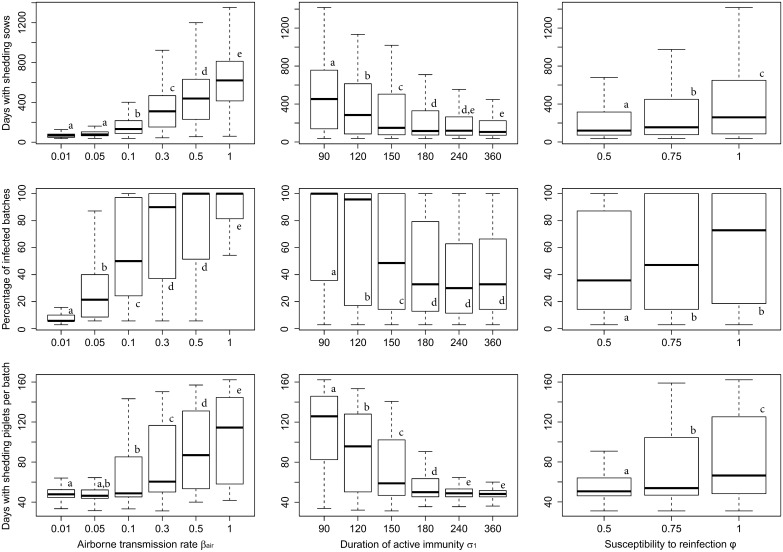
Fig 3. Boxplots representing the exploration of the variation of selected outputs (rows) according to the range of variation of each uncertain factor (columns).
The first column corresponds to the variation of the factor “between-batch transmission rate through the airborne route βair”, with 6 variation levels. The second corresponds to “the duration of the active immunity period σ1”, with 6 variation levels and the third column corresponds to “the susceptibility to reinfection φ”, with 3 variation levels. Different letters within panel (a, b, c, d and e) represent statistically different distributions (Kruskal-Wallis test).

