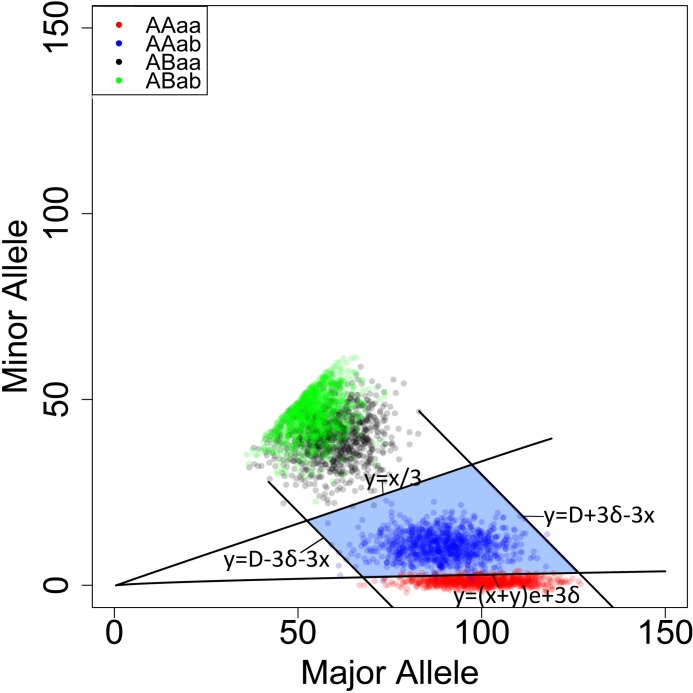
Fig 2. The distribution of SNPs in maternal plasma.
The x-axis and y-axis show the depth of major (A/a) and minor alleles (B/b), respectively. y = D + 3δ − x and y = D − 3δ − x are simplified as the form of x+y = u+3*δ, where D denotes the depth of the SNP loci. (x+y)*e of Line 2 y = (x + y)e + 3δ represents the depth of minor alleles of category 1 (AAaa) caused by sequencing errors. The expectation (u) of the normal distribution is equal to the variance (δ2) when the Poisson distribution is approximately close to the normal distribution. Thus, δ2 is approximately equal to the mean of (x+y) in the equation y = (x + y)e + 3δ. Similarly, δ2 will be roughly equal to D in the functions y = D + 3δ − x and y = D − 3δ − x.

