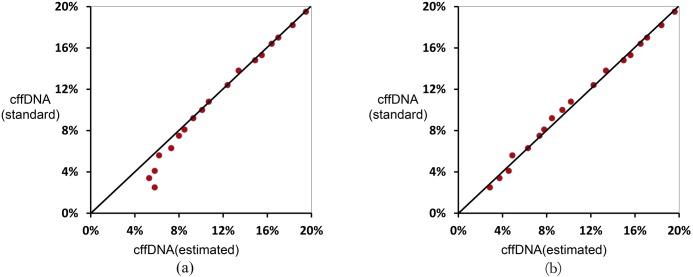
Fig 3. The estimated fractional fetal DNA concentration before and after the fitting correction.
The x-axis and y-axis represent the estimated value and standard value of the cell-free fetal DNA concentration in the plasma, respectively. (a) Most estimated values are close to the standard values. However, the estimated value was higher than the standard value when the standard value was less than 8%. (b) The bias was corrected through the equation (S1 Table) generated by the corrected model. Finally, the deviation was reduced to a satisfactory level when most of the estimated values and standards were in the diagonal line.

