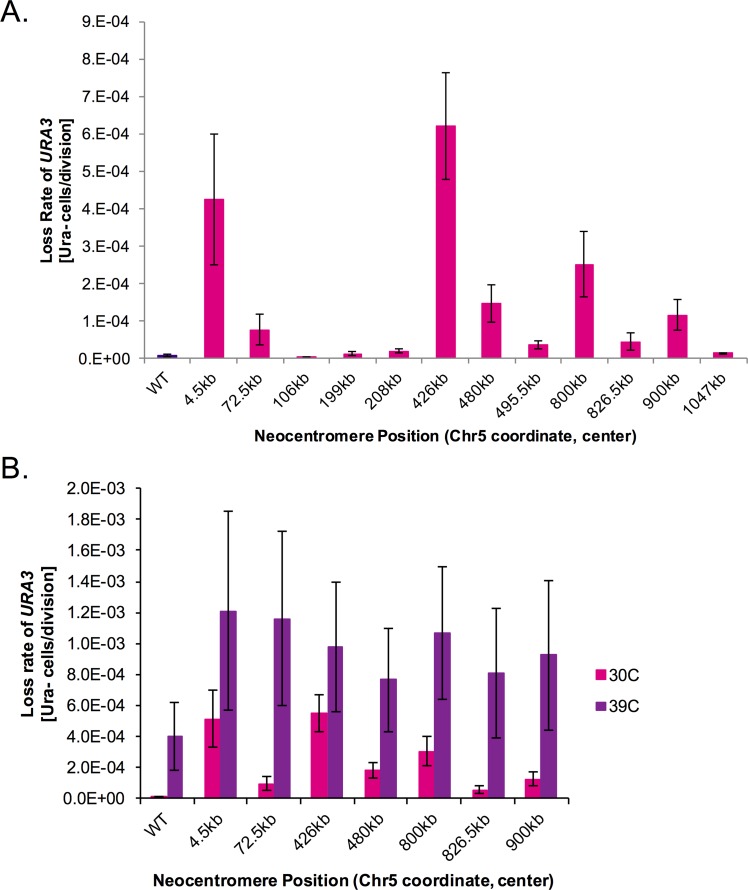
Fig 3. Neocentromere strains have different URA3 loss rates.
A. Fluctuation analysis of loss of URA3 in control (INT1/int1Δ::ura3) (dark purple) and neocentromere (CEN5/cen5Δ::ura3) (magenta) strains. Cultures of each strain were grown in YPAD for 24 h at 30°C. Loss of URA3 was quantified by plating cells on non-selective media (YPAD) and on media containing 5-FOA to select for loss of URA3. Colony counts were used to calculate the rate of loss per cell division. Results are the mean ± SEM of the rates calculated from at least 3 experiments, each with 8 cultures per condition. p<0.01 for strain differences by ANOVA. B. Cultures of each strain were grown in YPAD for 24 h at 30°C (magenta) or 39°C (purple). Loss of URA3 was quantified by plating cells on non-selective media and on media containing 5-FOA to select for loss of URA3. Colony counts were used to calculate the rate of loss per cell division. Results are the mean ± SEM of the rates calculated from at least 3 experiments, each with 8 cultures per condition. p<0.01 for heat treatment differences and p>0.05 for heat*strain interaction by two-way ANOVA.

