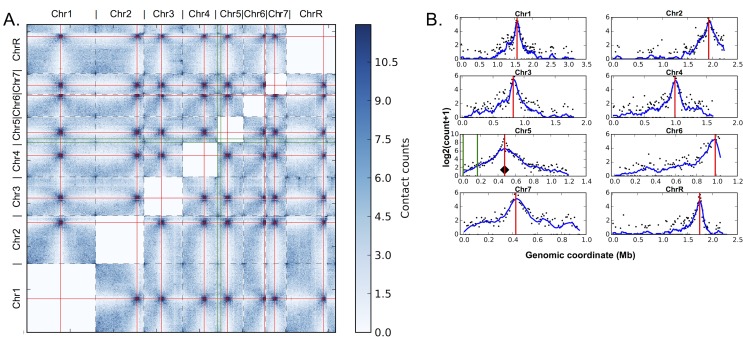
Fig 5. Centromere clustering is a feature of active centromeres in C. albicans.
Red lines mark centromeres. Green lines indicate neocentromere positions. Black diamond indicates the viewpoint for the plotted interaction profiles. A. Heatmap of genome-wide interchromosomal interactions from the Hi-C data of the wild type strain with all active centromeres at their native positions. Normalized contacts counts are shown in increasing intensity of blue. Borders of chromosomes are shown with dashed lines. B. Virtual 4C plots from the 10kb sequence surrounding the center of native CEN5 showing log-scaled Hi-C contact counts for all C. albicans chromosomes in the wild type strain.

