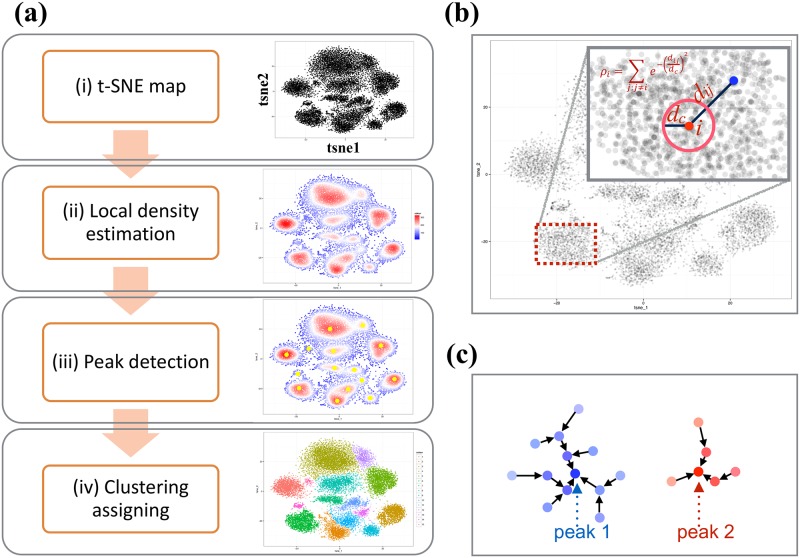
Fig 2. Workflow of ClusterX for mass cytometry data clustering.
(a) depict the workflow of ClusterX for mass cytometry data clustering, which contains four steps: (i) t-SNE dimensionality reduction (ii) estimate the local density on the t-SNE map (iii) detect the density peaks represented as cluster centers and (iv) assign the remaining cells to clusters. (b) Explains the local density estimation method. (c) Illustrate the cluster assigning step using two peaks, peak1 and peak 2. Each point is a cell and the color intensity represents the local density of the cell. Then each cell is assigned to be the same cluster as its nearest neighbor cell which has higher density than it.

