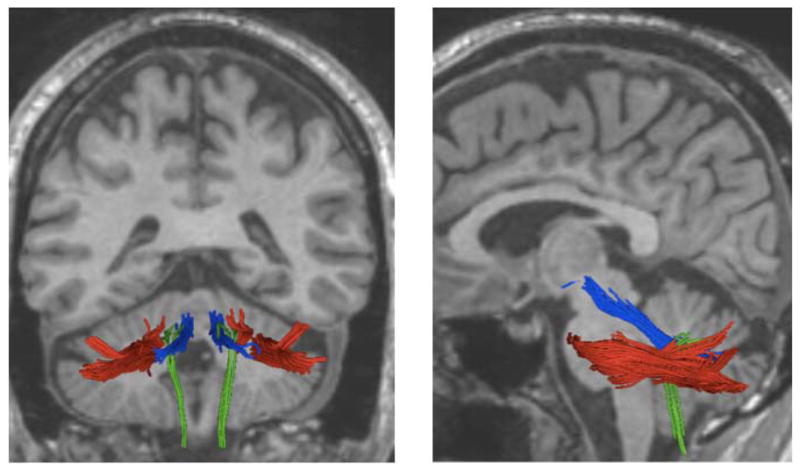
Figure 2. Cerebellar tracts.

Middle cerebellar peduncle (mcp, colored in red), superior cerebellar peduncle (scp, in blue) and inferior cerebellar peduncle (icp, in green) were reconstructed from DTI images. Structural MRI image of the brain is in the background (black and white). Posterior view of the brain in the panel left, side view of the brain in the panel on the right.
