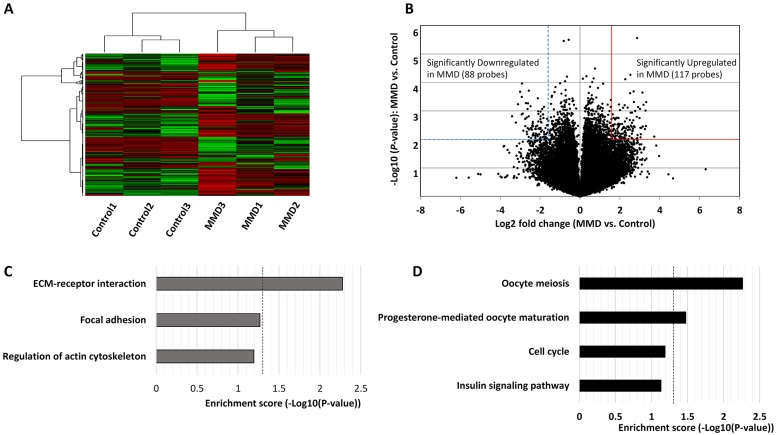
Fig 4. The result of DNA microarray analysis.
Panel A shows unsupervised clustering analysis of moyamoya disease (MMD)—and control—iPSECs. Panel B shows the volcano plot of all probes. The broken blue line and continuous red line denote significantly downregulated and upregulated genes in MMD-iPSECs, respectively (fold change >3, P < 0.01). Panels C and D show the significantly downregulated and upregulated genes in pathway analyses of MMD-iPSECs, respectively. Dotted line indicates the significance level (P < 0.05).

