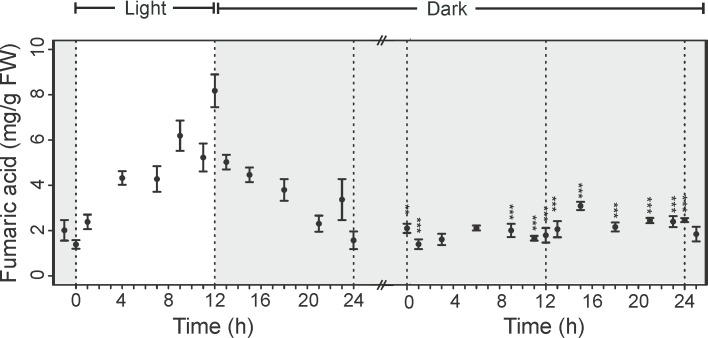
Fig 5. Changes in the levels of fumaric acid in the leaves of Arabidopsis thaliana.
Fumaric acid was measured in intact leaves at different time points during: 12h light/12h dark period (A) and during continuous dark period (B). Results are mean of 4 replicates ± standard error (** p < 0.01, *** p < 0.001).

