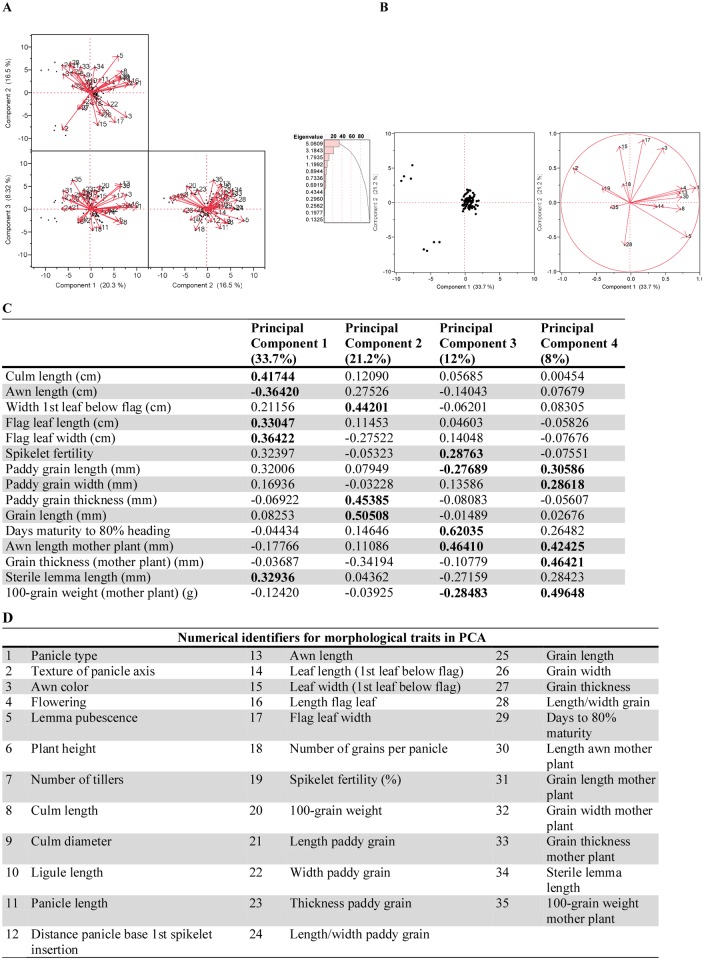
Fig 5. California weedy and cultivated rice phenotypic trait decomposition.
5A. PCA of California weedy and crop (medium-grain and specialty) rice. Highly correlated traits and traits with no variation excluded. 5B. PCA biplot of the refined PCA analysis of California weedy, medium-grain crop, and specialty crop rice traits which are key players in separating the three clusters. 5C. Eigenvector values for a refined California weedy and crop rice dataset of 15 traits with highly correlated measurements and those with no variation excluded (from 5B). 5D. List of traits corresponding to the numeric labels (1–35) of PCA vectors in 5A-5C. The length and direction of each vector indicate the strength and type (positive or negative) of the correlation between specific traits and the PCs.

