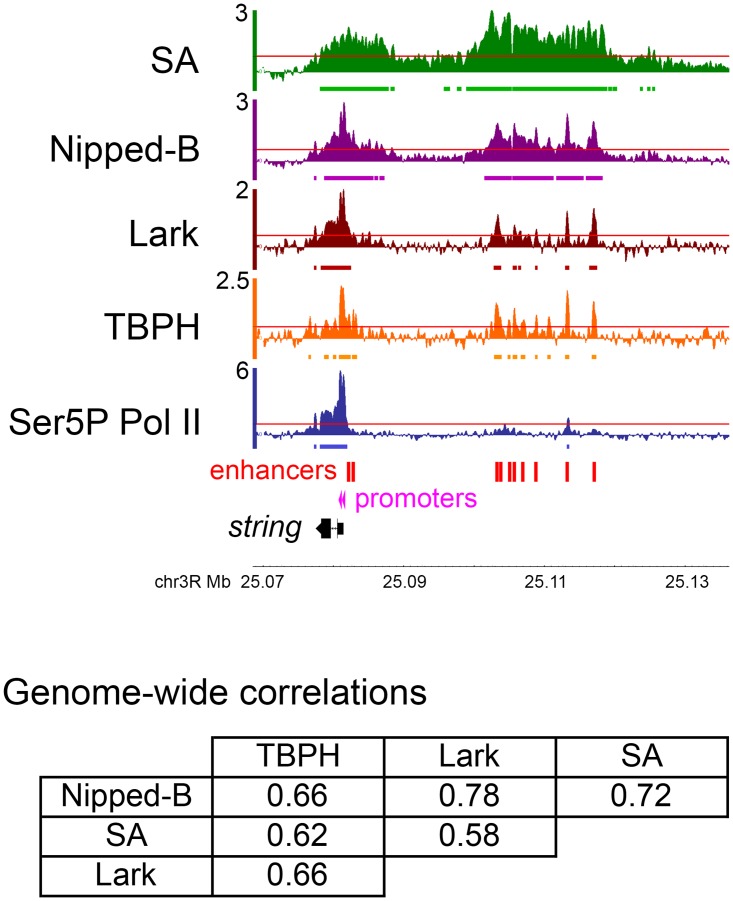
Fig 1. Co-occupancy of genes and regulatory sequences by Nipped-B, cohesin, and the TBPH and Lark RNA-binding proteins in BG3 cells.
The genome browser tracks show the log2 ChIP-seq enrichment for cohesin (SA, green), Nipped-B (purple), Lark (brown), TBPH (orange) and Ser5P Pol II (transcriptionally-engaged paused and elongating Pol II, blue) at the string (cdc25) gene, and its upstream enhancers (red boxes). The two active string transcription start sites detected by PRO-seq [17] are indicated by pink arrowheads. Genome-wide Pearson correlation coefficients between Nipped-B, SA, TBPH and Lark ChIP-seq enrichment are in the table below the genome browser panel. The ChIP-seq enrichment for SA, Nipped-B and Ser5P Pol II are the average of two independent biological replicates (independent cell cultures, chromatin preparations and immunoprecipitation). The Lark ChIP-seq data is the average of five biological replicates, and the TBPH ChIP-seq is the average of four biological replicates. Each replicate was sequenced to ~10X genome coverage and normalized to input chromatin to calculate sequence enrichment in 250 bp sliding windows positioned 50 bp apart [24]. This procedure gives smoothened enrichment values at data points spaced 50 bp apart. As illustrated by the browser tracks, this method detects occupancy both in broad regions and in narrow peaks. It provides sensitivity equivalent to ChIP-chip for Nipped-B and cohesin [24]. Red lines in each browser track indicate the 95th percentile for enrichment for that protein, and the bars beneath each track show where enrichment is >95th percentile over regions >300 bp in length (>6 consecutive data points).

