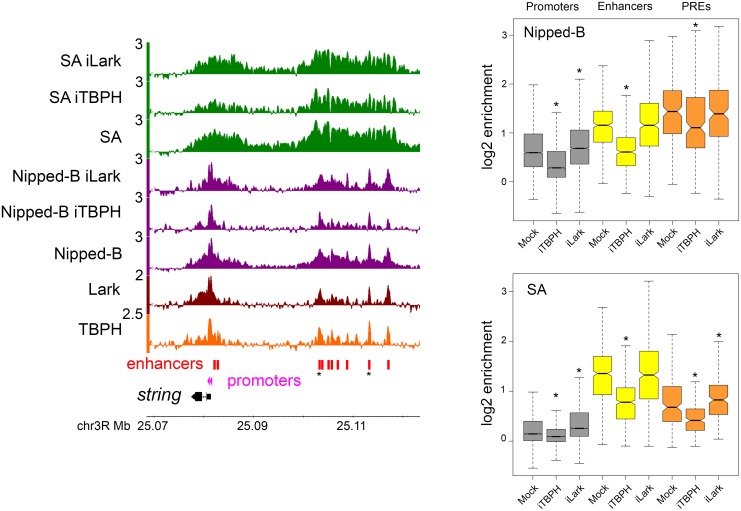
Fig 3. TBPH and Lark depletion alter Nipped-B and cohesin occupancy at gene regulatory sequences in BG3 cells.
The browser tracks show the log2 enrichment for TBPH, Lark, Nipped-B, SA, and Nipped-B and SA after RNAi depletion of TBPH (iTBPH) and Lark (iLark) for the string gene and its upstream enhancers. The string enhancers that are most resistant to decreases in Nipped-B and SA occupancy upon TBPH depletion are marked with asterisks. The tracks shown are the average of two to five independent biological replicates. The boxplots show the distributions of the average log2 enrichment for all active promoters (gray), extragenic enhancers (yellow) and PREs (orange) in mock-treated (Mock) cells, and cells in which TBPH (iTBPH) or Lark (iLark) have been depleted by RNAi for four to five days. Gene regulatory elements are defined as shown in Fig 2. Asterisks indicate distributions that differ significantly from the mock control using a paired t test. The p values are given in the main text. A paired t test was used because each regulatory sequence is matched with itself in the control and depleted cells and the distributions are close to normal. All comparisons indicated as significant are also significant using the non-parametric Wilcoxon signed rank test. Plots of the values for all individual regulatory sequences in mock control versus the depleted cells are shown in S6 Fig.

