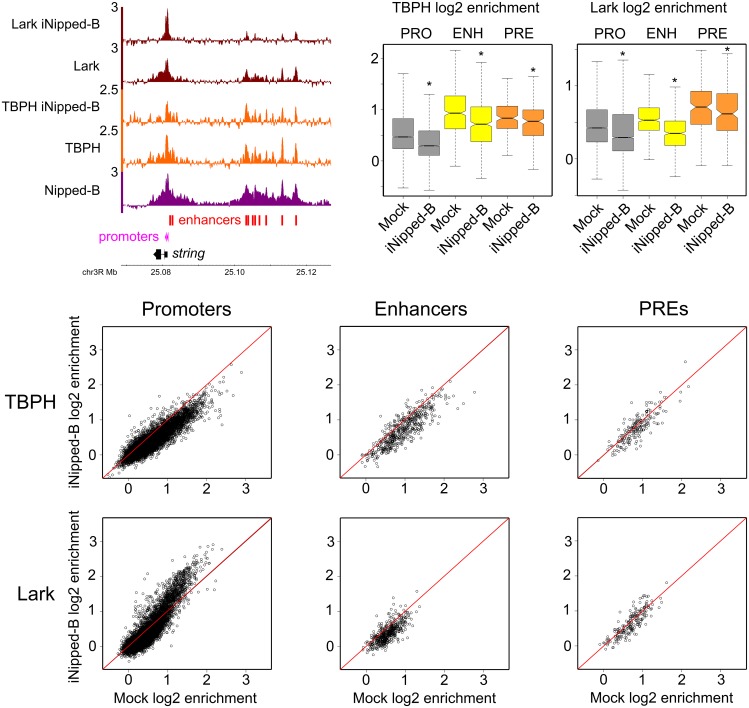
Fig 4. Nipped-B facilitates binding of TBPH and Lark to gene regulatory sequences in BG3 cells.
The browser view at the upper left shows log2 ChIP-seq enrichment tracks for Nipped-B in control cells, and for TBPH and Lark in control cells and cells depleted for Nipped-B (iNipped-B) at the string gene and its enhancers. The boxplots at the upper right show the distributions of ChIP-seq enrichment for TBPH and Lark at active promoters (PRO) extragenic enhancers (ENH) and PREs (PRE) in control (Mock) cells and cells depleted for Nipped-B (iNipped-B). Four biological replicates were averaged for the TBPH ChIP-seq and two for Lark ChIP-seq in Nipped-B depleted cells. Distributions that differ significantly from the Mock control by the paired t test are marked with asterisks, and the p values are given in the main text. All marked comparisons are also significant by the Wilcoxon signed rank test. For each regulatory sequence, the log2 enrichment values in Mock control cells (Mock log2 enrichment) are plotted against the enrichment values in cells depleted for Nipped-B (iNipped-B log2 enrichment) in the dot plots.

