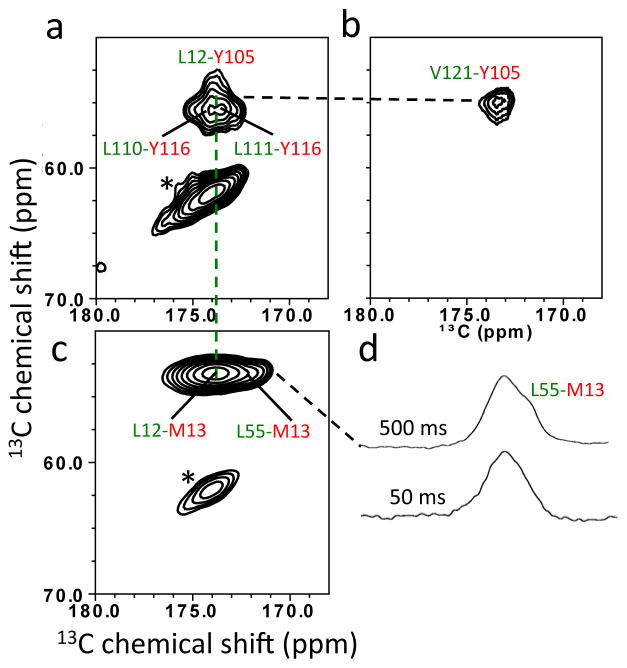
Figure 5.
2D PDSD spectra of amyloid states of WT TTR with a contour level of 1.5 % obtained using different labeling schemes. A mixing time of 500 ms was used, unless indicated. (a) 13CO-Leu and 13Cα-Tyr. (b) 13CO-Val and 13Cα-Tyr. (c) 13CO-Leu and 13Cα-Met. (d) 1D slices for the 13CO-Leu and 13Cα-Met PDSD spectra with two mixing times of 50 ms and 500 ms. * denotes spinning sidebands.

