. 2016 Aug 15;5:e18215. doi: 10.7554/eLife.18215

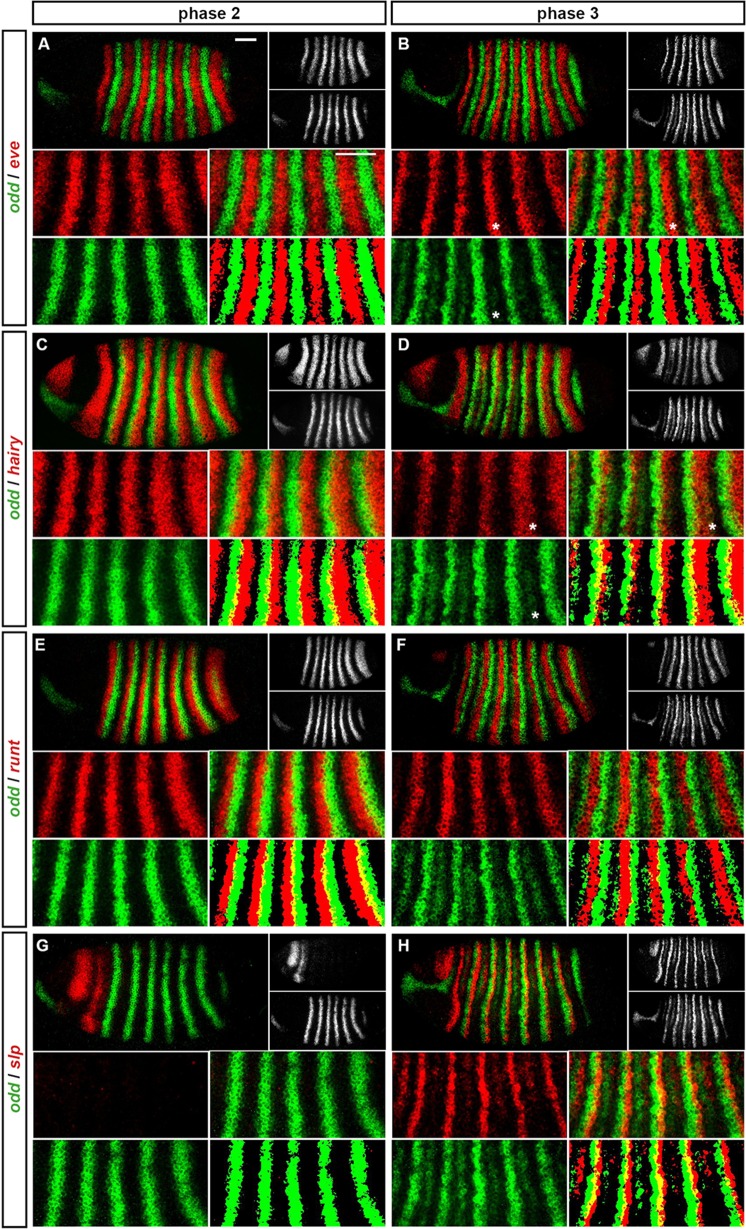
Appendix 1—figure 1. Expression of odd at phase 2 versus phase 3.

Relative expression of odd and other pair-rule genes (A, Beve; C, Dhairy; E, Frunt; G, H - slp) is shown in late phase 2 embryos (A, C, E, G) and in early phase 3 embryos (B, D, F, H). Individual channels are shown to the right of each whole embryo double channel image (odd bottom, other gene top). Other panels show blow-ups of expression in stripes 2–6 (individual channels, double channel image, and thresholded double channel image). odd expression is always shown in green. odd expression overlaps with eve and hairy at phase 3 (e.g. asterisks marking nascent secondary stripe expression in B, D) but not at phase 2 (A, C). odd expression overlaps with runt at phase 2 (E) but not phase 3 (F). slp expression is absent for most of phase 2 (G) and is responsible for posterior narrowing of odd primary stripes at phase 3 (H). Scale bars = 50 μm. See text for details.

DOI: http://dx.doi.org/10.7554/eLife.18215.023

Appendix 1—figure 1.

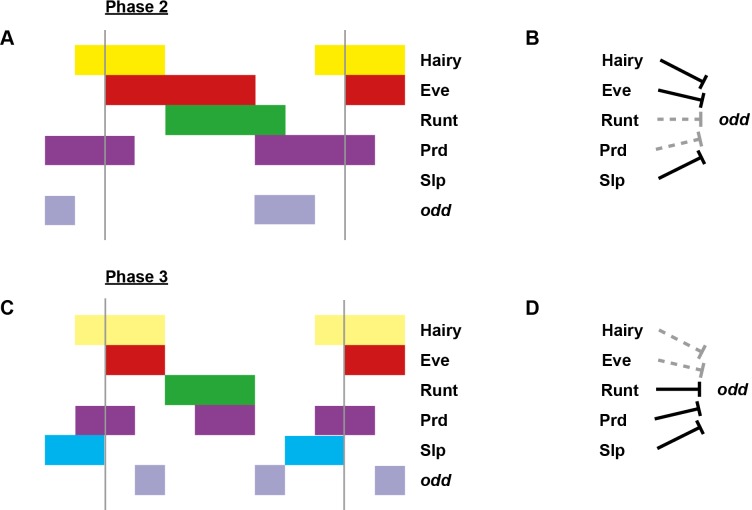
Appendix 1—figure 1—figure supplement 1. Model for the regulation of odd transcription at phase 2 versus phase 3.

Appendix 1—figure 1—figure supplement 1.

Model for the differential regulation of odd expression by pair-rule proteins at late phase 2 (A, B) versus mid phase 3 (C, D). (A, C) Schematic diagrams showing the expression of odd relative to potential regulators. The horizontal axis represents an idealised portion of the AP axis (~12 nuclei across). The grey vertical lines demarcate a double parasegment repeat (~8 nuclei across). Lighter yellow in (C) represents fading Hairy expression. (B, D) Inferred regulatory interactions. Hammerhead arrows represent repressive interactions. Solid black arrows represent interactions that are currently in operation; dashed grey arrows represent those that are not. At each stage, odd is expressed only where its current repressors are absent. See Figure 5 and Appendix 1—figure 1 for staged relative expression data. Note that the expression patterns of potential regulators diagrammed in this figure represent protein distributions, which often differ slightly from transcript distributions due to time delays inherent in protein synthesis and decay (see Figure 6).