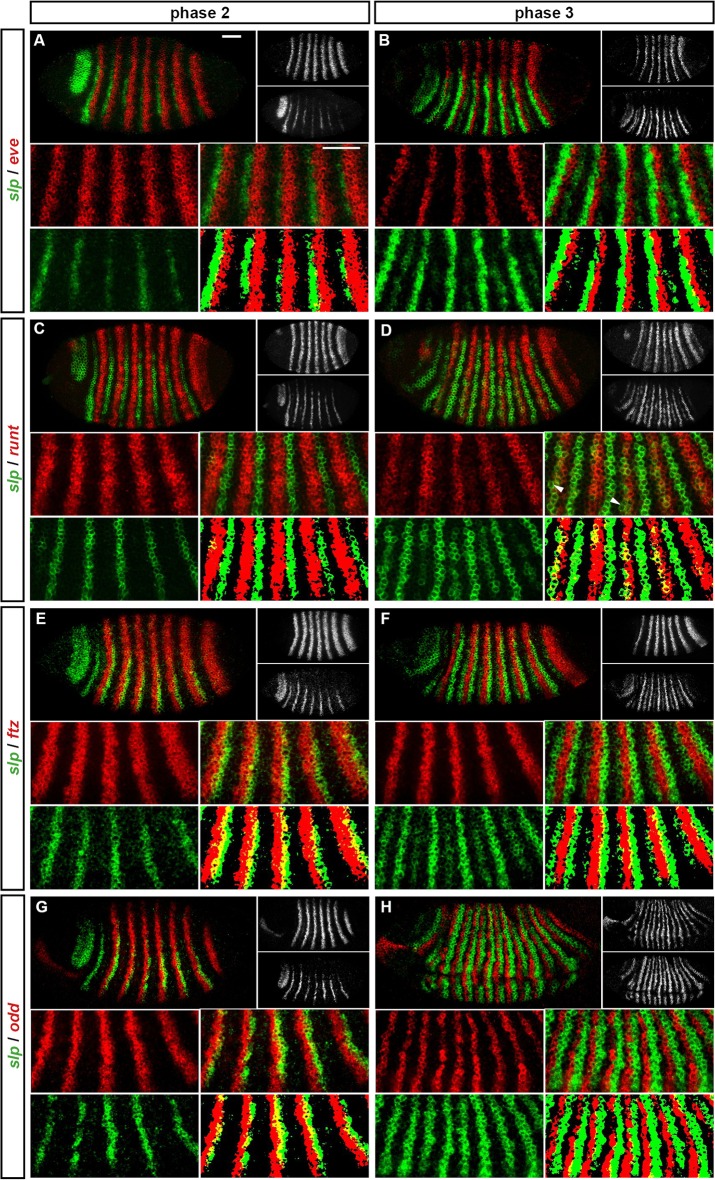
Appendix 1—figure 2. Expression of slp at phase 2 versus phase 3.
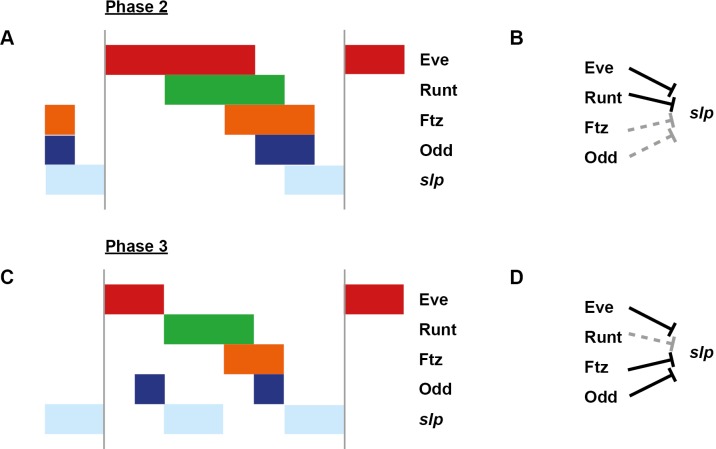
Relative expression of slp and other pair-rule genes (A, B – eve; C, D – runt; E, F – ftz; G, H - odd) is shown in late phase 2 embryos (A, C, E, G) and in early phase 3 embryos (B, D, F, H). Individual channels are shown to the right of each whole embryo double channel image (slp bottom, other gene top). Other panels show blow-ups of expression in stripes 2–6 (individual channels, double channel image, and thresholded double channel image). slp expression is always shown in green. slp expression overlaps with runt at phase 3 (D) but not at phase 2 (C). slp expression overlaps with ftz and odd at phase 2 (E, G) but not phase 3 (F, H). slp expression never overlaps with eve (A, B). Arrowheads in (D) indicate cells where slp secondary stripe expression does not coincide with runt expression. Scale bars = 50 μm. See text for details.


